
A plain-language guide to comparing performance with the Sharpe, Sortino and Calmar ratios.
An Etesia primer, the second in a series. Reading time: about 10 minutes.
Picture two funds over the same five years. Fund A earned 18% a year. Fund B earned 12% a year. Which did better?
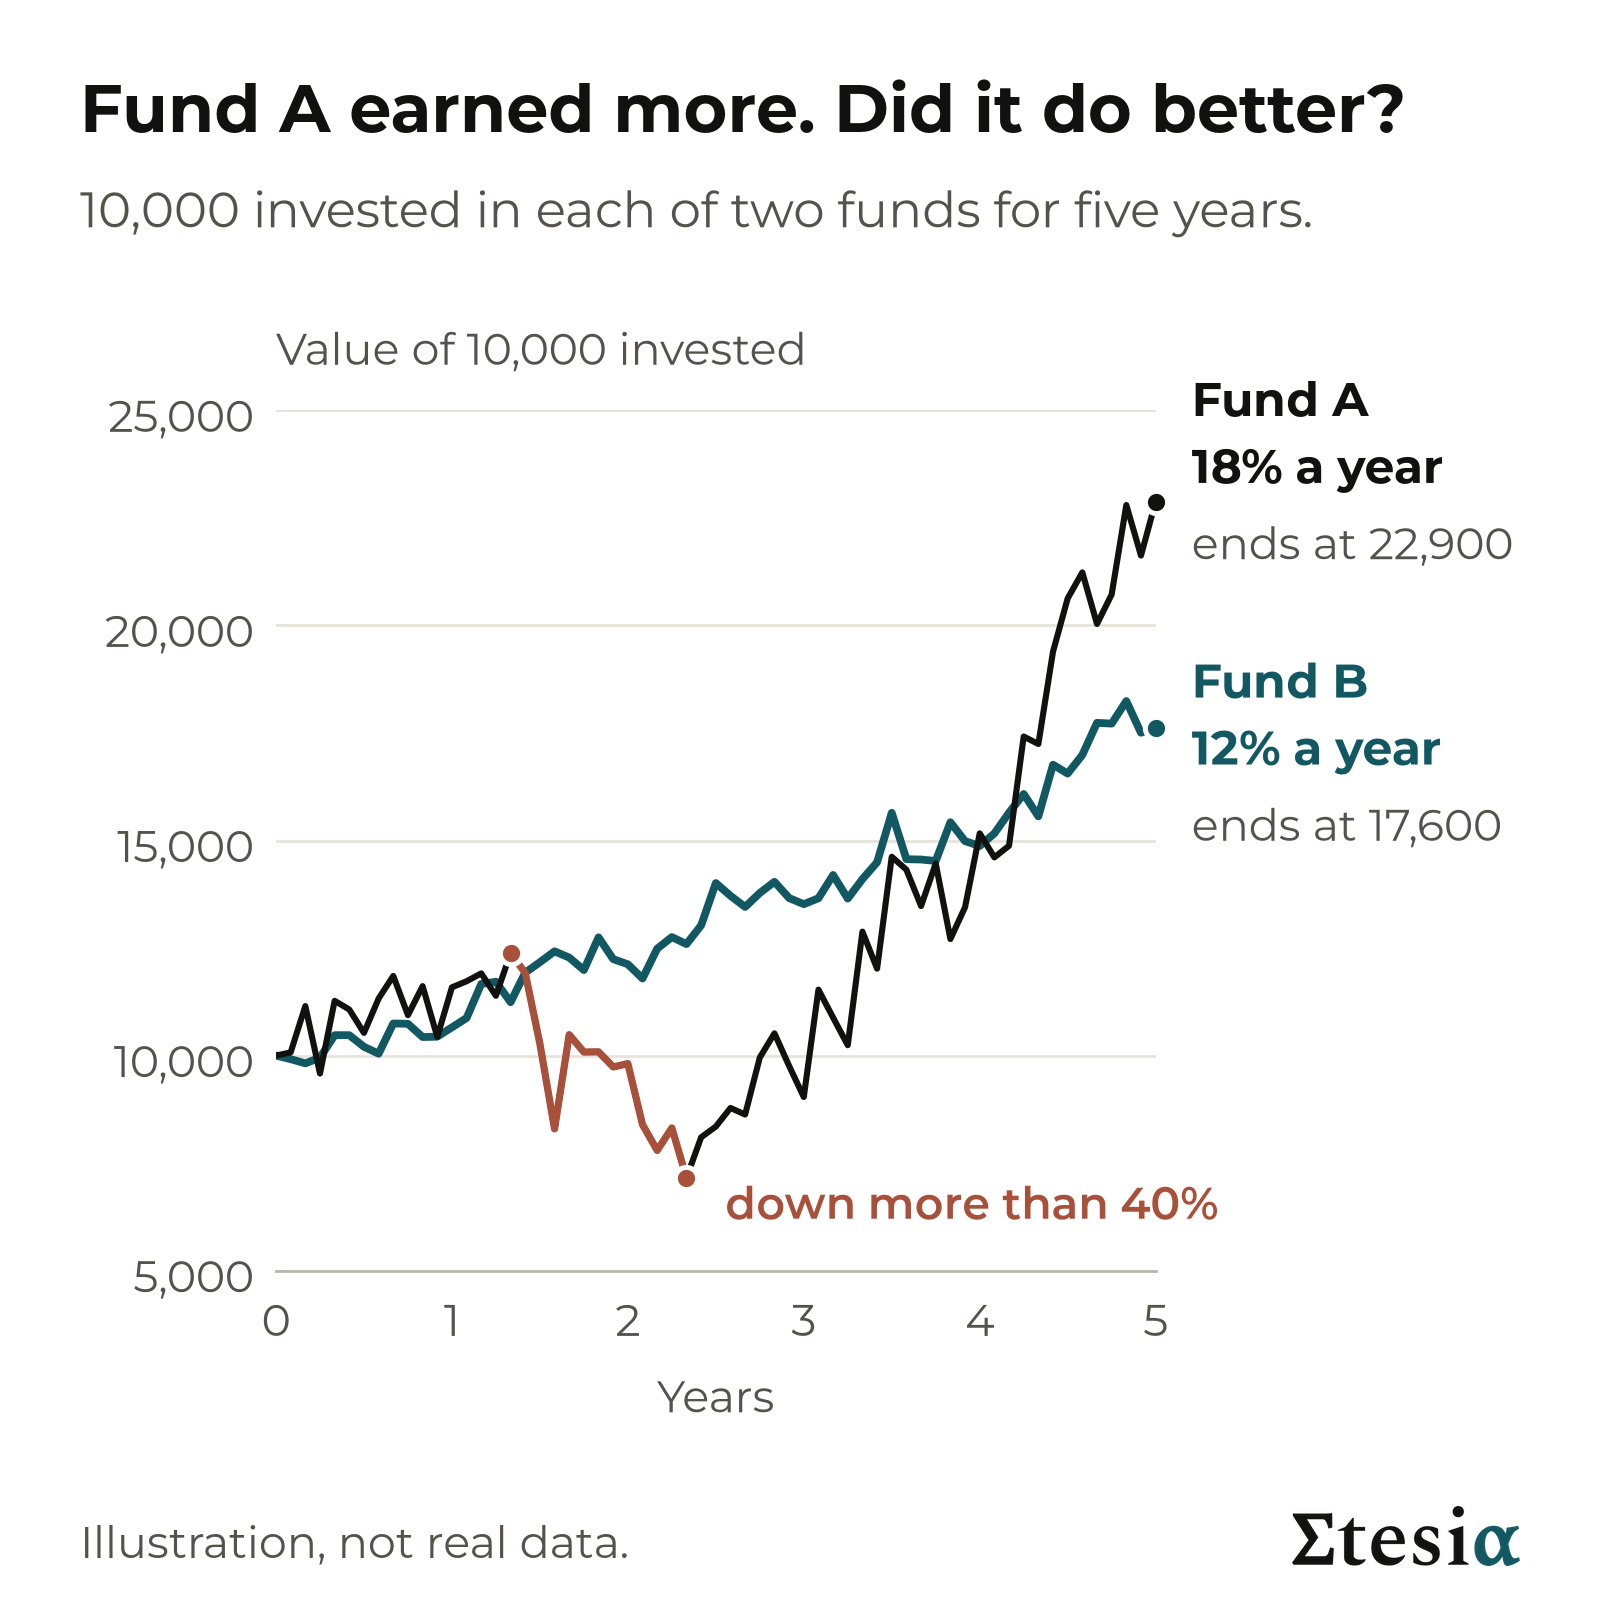
Most people say A, and on return alone they are right. But look at the ride. At one point Fund A’s investors were down more than 40% from its high, and for long stretches they were behind Fund B.
In a shop you do not compare two packets by the price on the front. You look at the price per kilo. Funds need the same treatment: the return for the amount of risk taken.
Three ratios do that job, each a simple division: Sharpe, Sortino and Calmar.
Takeaway: a return means little until you know how much risk was taken to earn it.
Two measures of risk, in brief
The first primer, What risk are you actually taking? (there is also a 3-minute video), explained two measures of risk that show on a price chart.
Volatility is the typical size of a year’s swing, up or down, as a percentage. A drawdown is a fall from a high point to the low that follows; the maximum drawdown is the deepest on record.
Takeaway: volatility is the typical swing, drawdown is the fall. Each ratio below divides a return by one of them.
The Sharpe ratio: return per unit of volatility
The Sharpe ratio answers one question. How much did an investment earn for each 1% of yearly swing?
The ratio is: yearly return divided by yearly volatility.
In money: put 10,000 in each fund for one year at its yearly rate.
Fund A earned 1,800, for a typical yearly swing of 3,600 (a volatility of 36%). 1,800 divided by 3,600 is 0.5.
Fund B earned 1,200, for a typical swing of 1,200 (12%). 1,200 divided by 1,200 is 1.0.
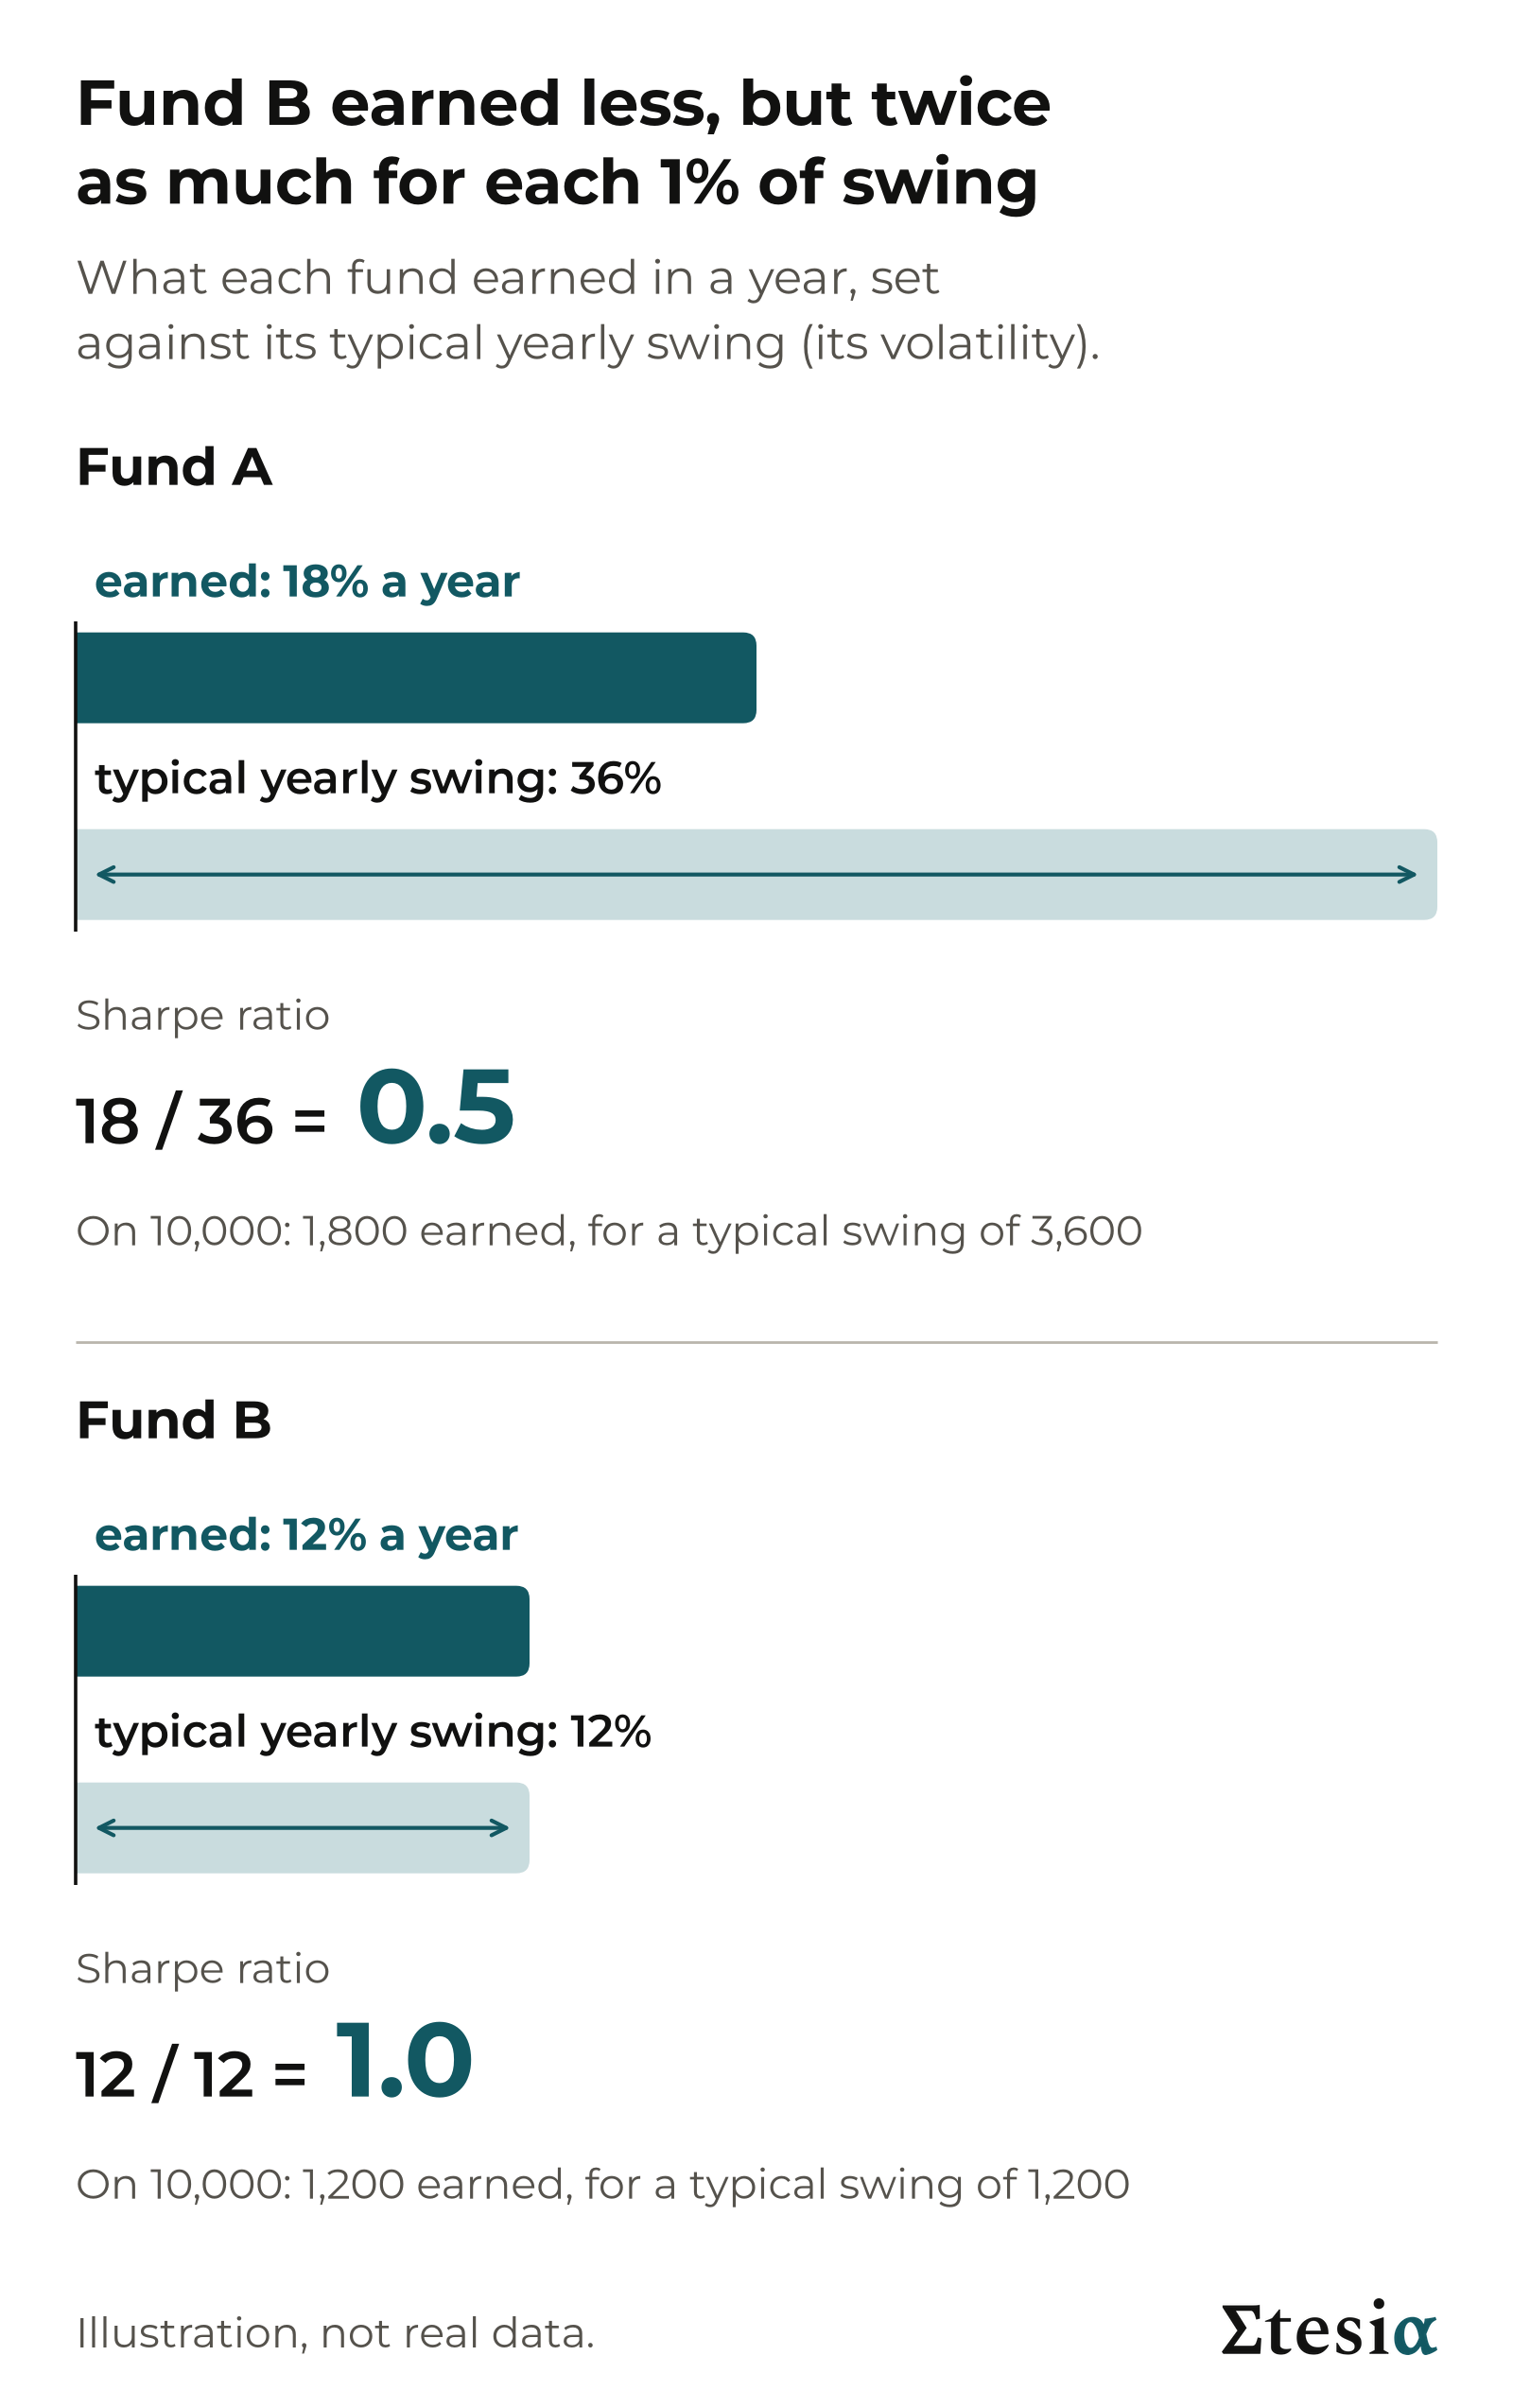
Fund B earned less, but twice as much for each 1% of swing.
Read the number this way. At 1, a fund earned as much as it typically swings in a year. At 0.5, half as much. At 2, twice as much.
Strictly, the ratio first takes off what savings pay, so that savings themselves score zero. Our examples skip that step to keep the sums simple; the market Sharpe and Sortino figures in this primer include it.
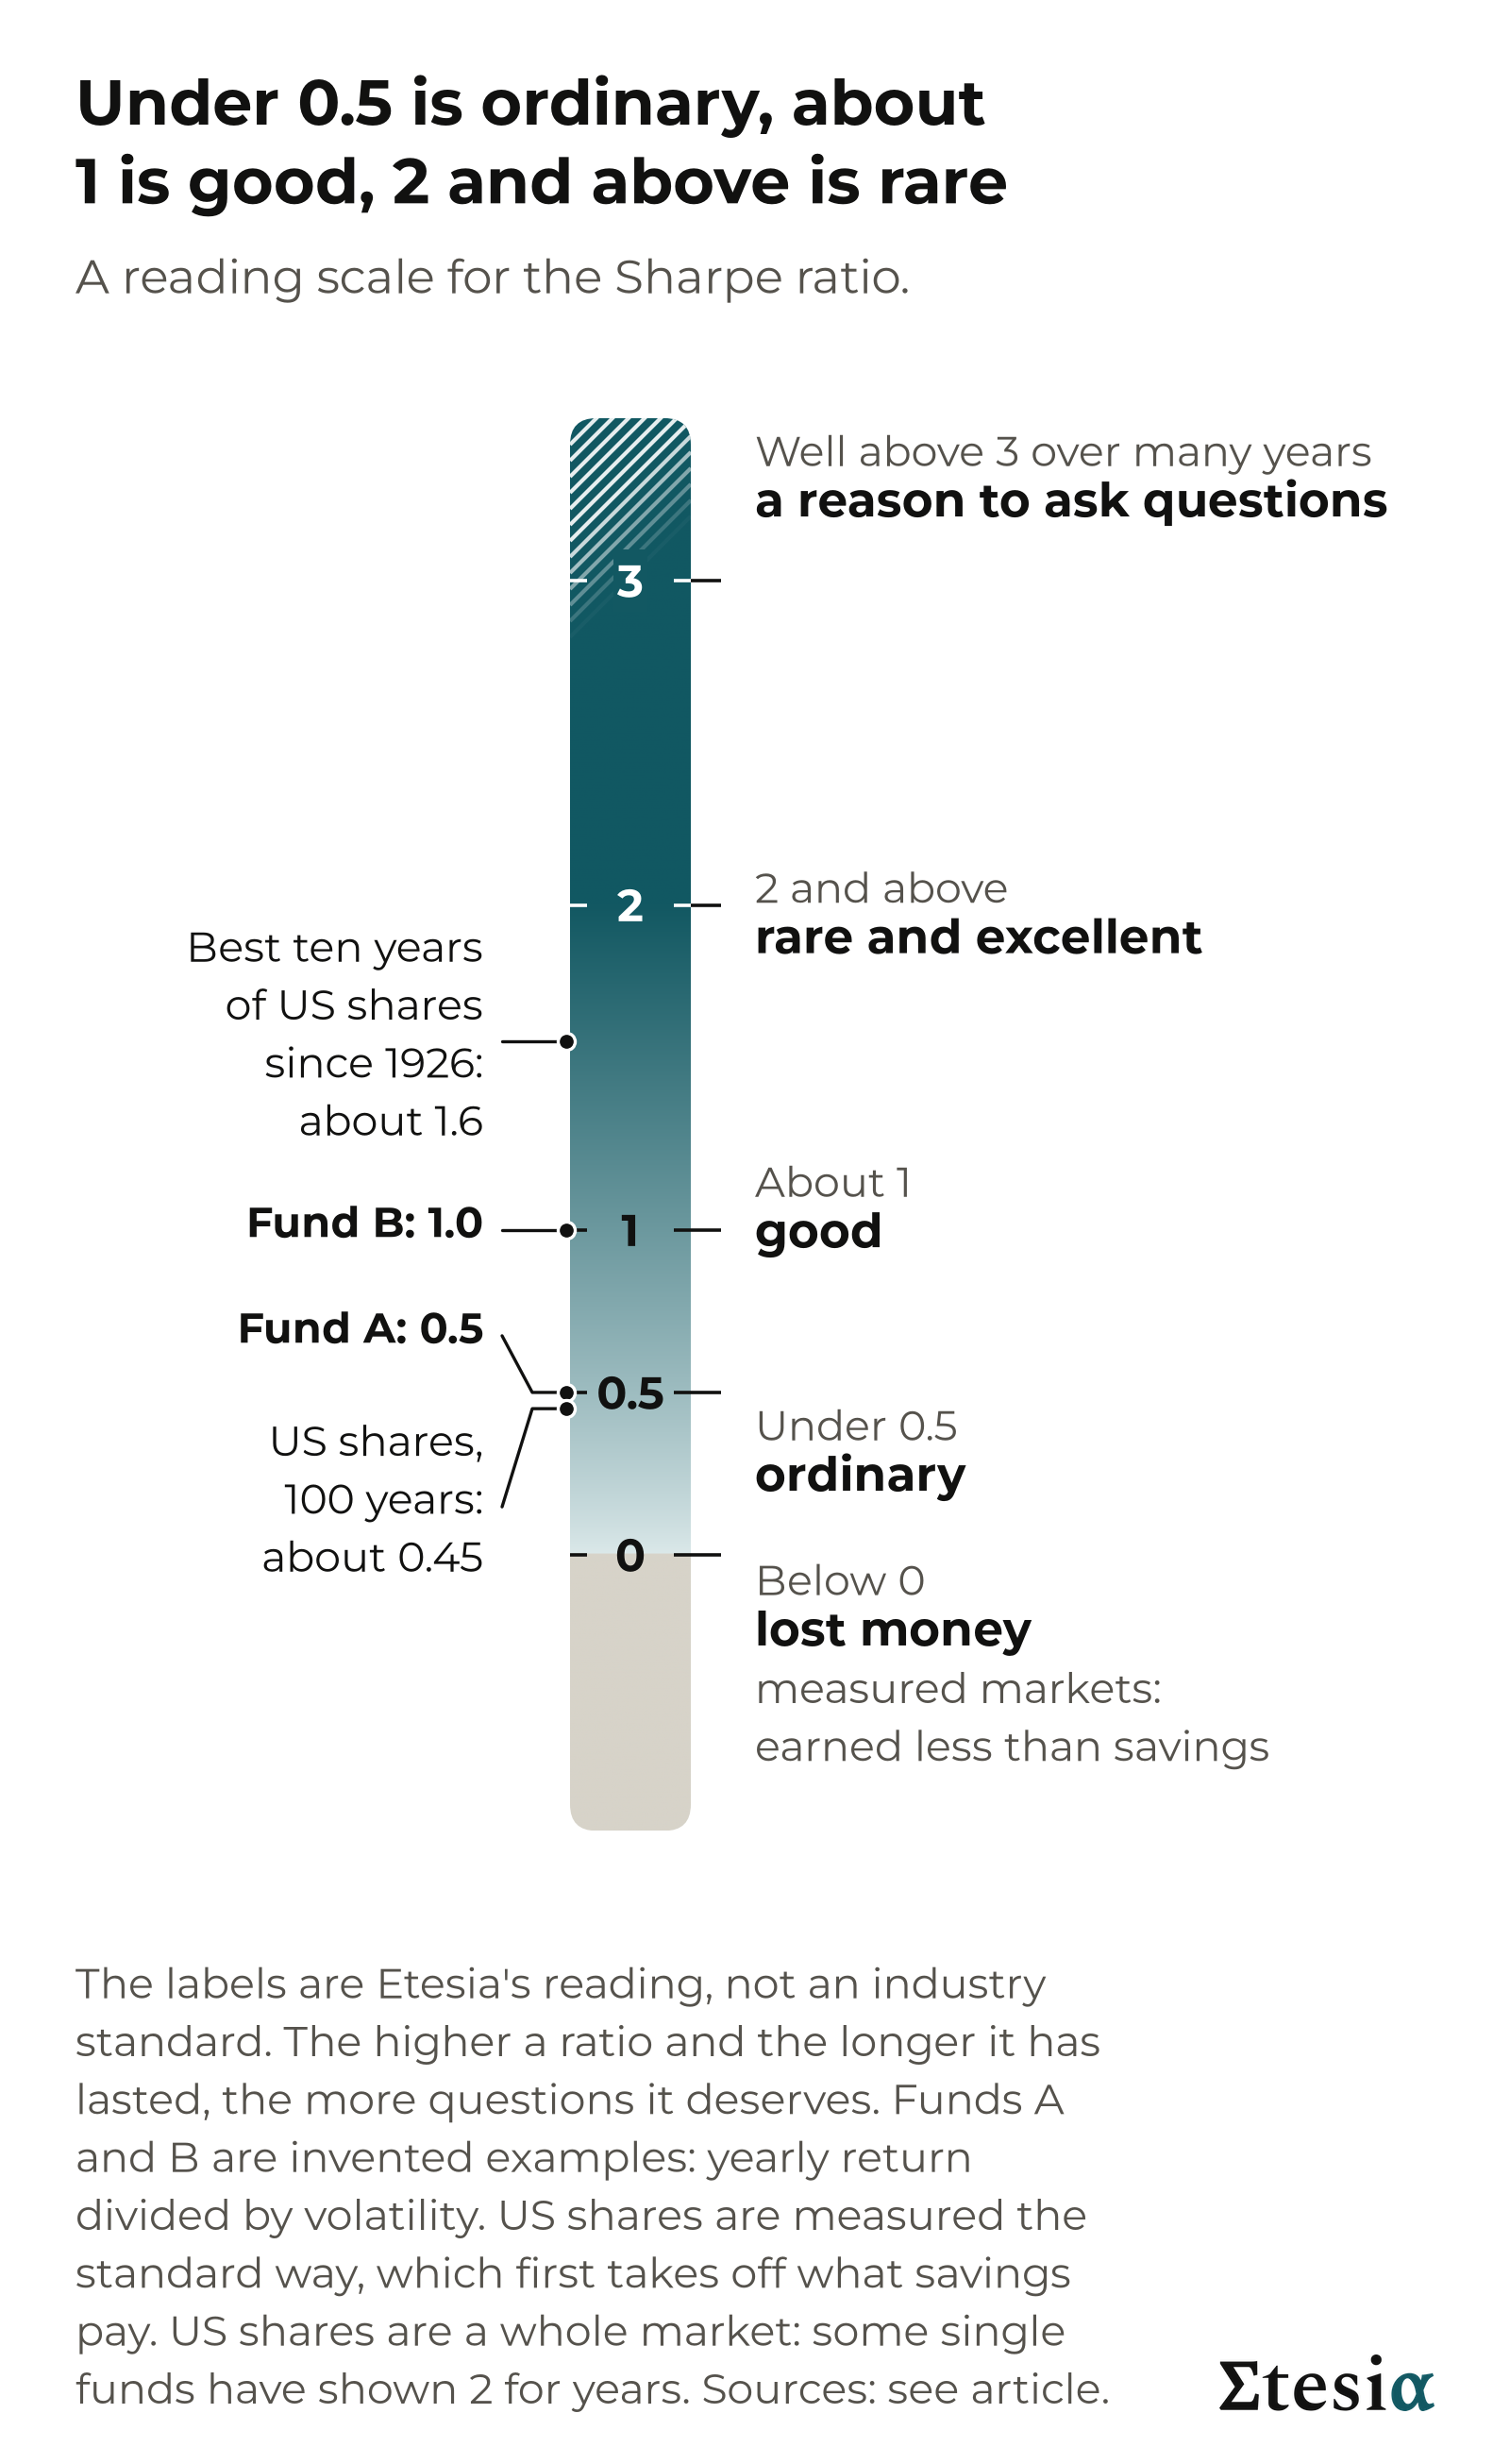
- Below 0: lost money; for a market figure, earned less than savings.
- Under 0.5: ordinary. US shares scored about 0.45 over the hundred years to August 2026.
- About 1: good.
- 2 and above: rare and excellent.
- Well above 3 over many years: a reason to ask questions.
Fund A, at 0.5, sits at the top of ordinary. Fund B, at 1.0, is good.
The higher a ratio and the longer it has lasted, the more you should ask how it is earned and who checks the figures. That applies to any fund, Etesia included.
Takeaway: the Sharpe ratio is the yearly return divided by volatility. Under 0.5 is ordinary, about 1 is good, 2 and above is rare.
The Sortino ratio: only the falls count
The Sharpe ratio has a blind spot. Volatility counts a swing up like a swing down, though only one hurts.
The Sortino ratio counts only the downward swings: the months that lost money.
The ratio is: yearly return divided by the typical size of the downward swings (known as downside deviation).
Funds C and D each earned 10% a year over ten years, with a volatility of 10%. Their Sharpe ratio is the same: 10 / 10 = 1.0. But Fund C climbs quietly and now and then drops sharply, while Fund D moves little and now and then jumps.
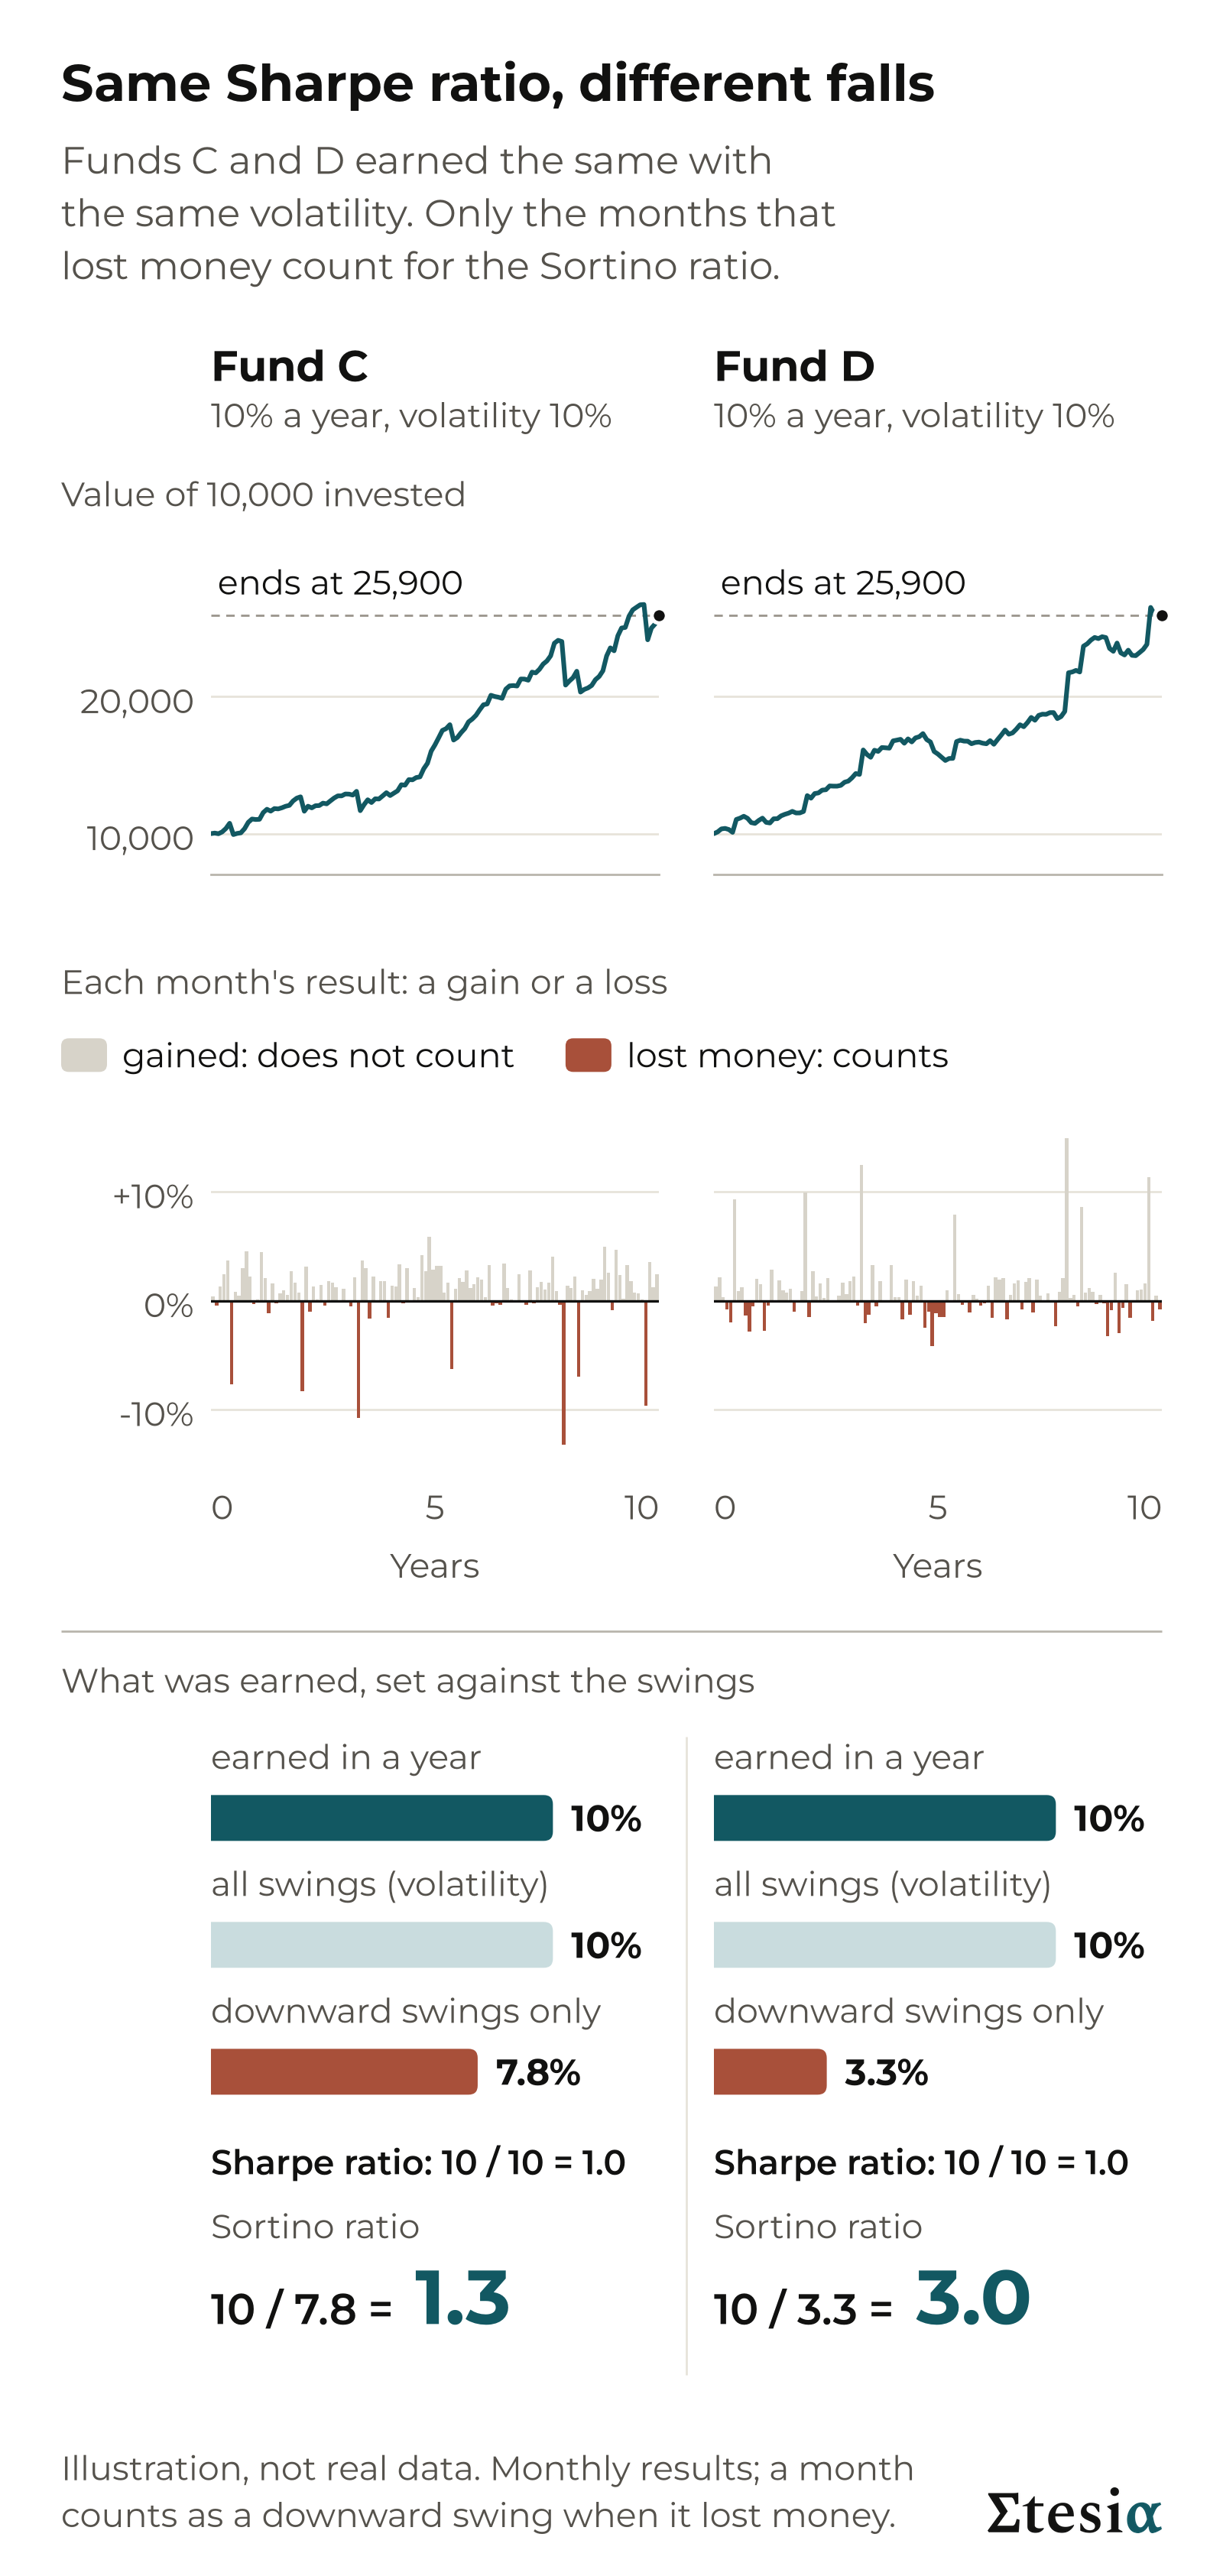
In money, on 10,000: each fund earned 1,000 a year, for a typical swing of 1,000. Count only the downward swings and the two funds differ: about 780 for Fund C, about 330 for Fund D. Fund C’s Sortino ratio is 1,000 / 780 = 1.3. Fund D’s is 1,000 / 330 = 3.0.
When a fund’s Sharpe ratio is above 0, its Sortino ratio is at least as high, so do not read it on the Sharpe scale. Compare Sortino with Sortino, measured the same way and over the same period.
Takeaway: when two funds have the same Sharpe ratio, the one with the higher Sortino ratio got more of its swings from rises than from falls.
The Calmar ratio: return against the deepest fall
Volatility describes a typical year. Many investors care more about the worst stretch: how far did the fund fall from its high? That is the maximum drawdown.
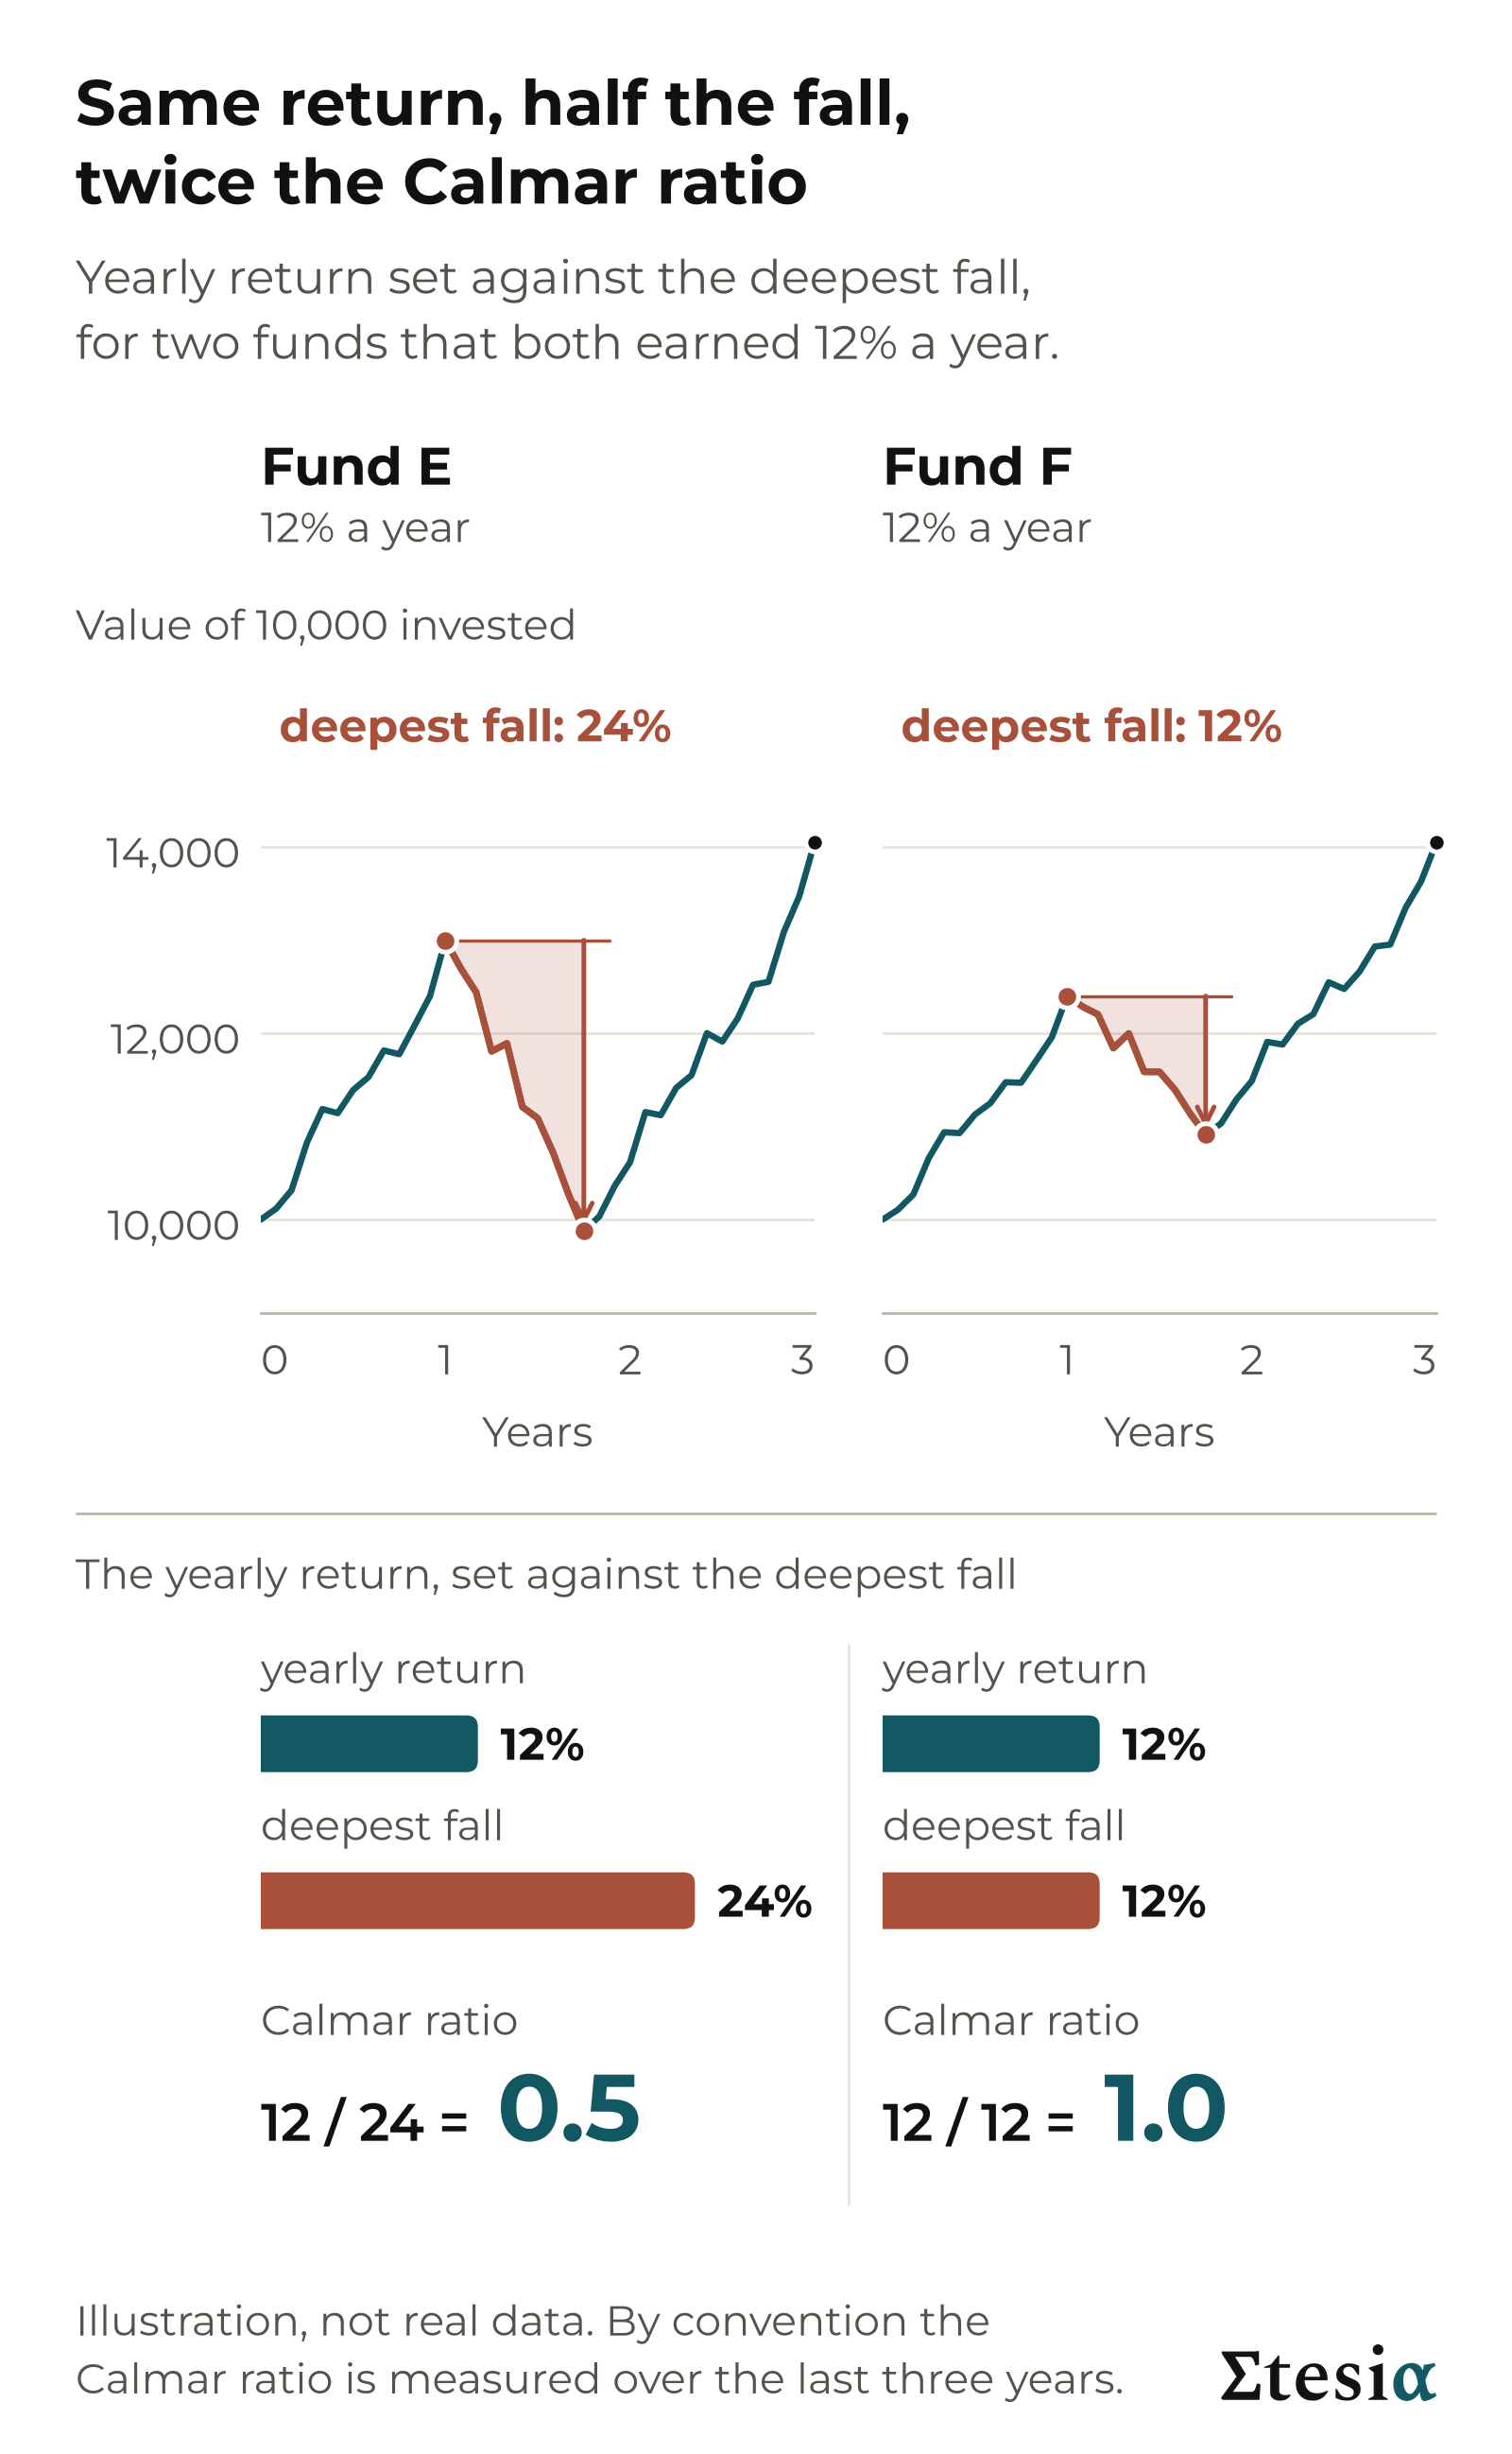
The Calmar ratio is: yearly return divided by the deepest fall over the same period. By convention the period is the last three years.
Fund E earned 12% a year, and its deepest fall was 24%. On 10,000, that is 1,200 a year earned against a fall of 2,400: a Calmar ratio of 0.5. Fund F earned the same 12% a year, but its deepest fall was 12%, or 1,200. Its Calmar ratio is 1.0.
A longer record has had more time to meet a deep fall. US shares show a Calmar ratio of about 0.1 to 0.25 over many decades, and about 2.5 over the three years to August 2026. No standard reading scale exists. And the deepest fall so far is not the deepest possible.
Takeaway: the Calmar ratio sets the yearly return against the deepest fall. Only compare figures measured over the same number of years.
What seven kinds of investment have scored
Here are the first primer’s seven kinds of investment, scored by Sharpe ratio. The ranges are approximate, describe the past and depend on the period measured.
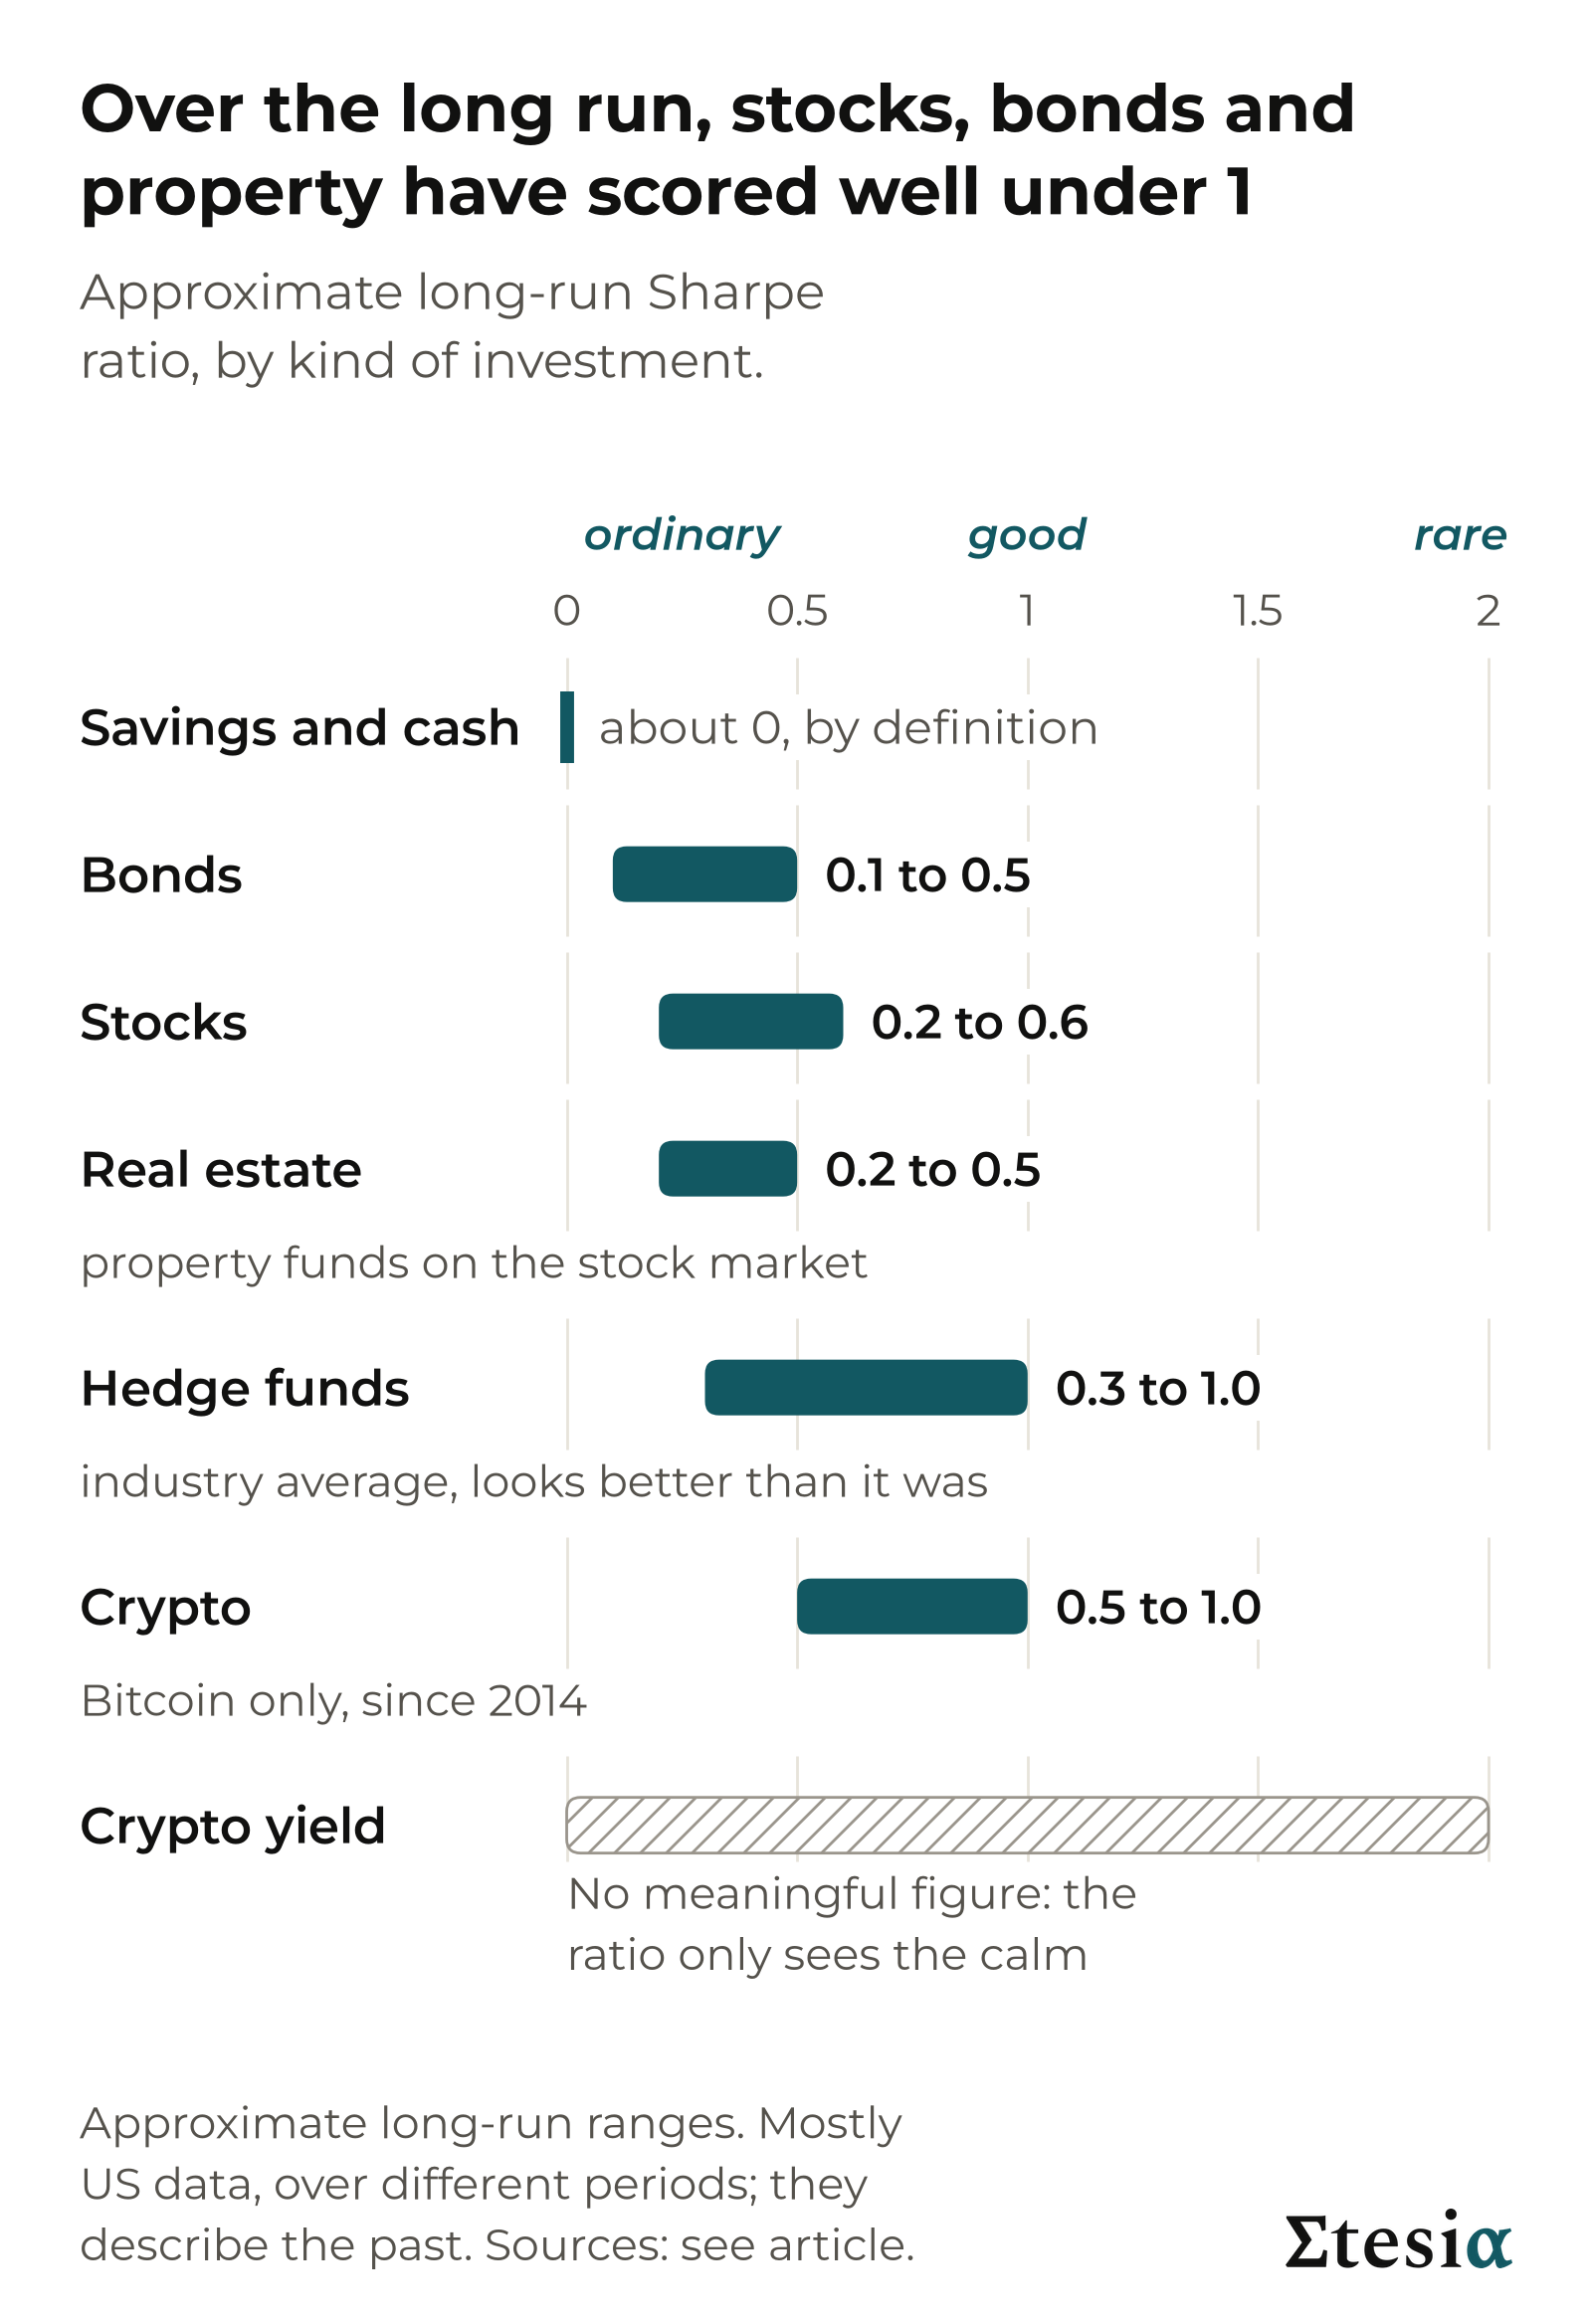
Savings and cash score about zero by definition: these market figures count only what was earned beyond savings.
Bonds, stocks and real estate have sat mostly in the ordinary range, between about 0.1 and 0.6.
Hedge funds (privately managed funds, often using borrowed money) have shown about 0.3 to 1.0 for the industry average. Funds that close stop reporting, so the average looks better than it was.
Crypto has shown about 0.5 to 1.0, for Bitcoin alone since 2014. One coin and a short record: a description of the past, not a ranking.
Crypto yield (products that pay interest on crypto deposits) gets no range, on purpose. A steady 20% a year on a coin whose price moves by 1% a year would show 20 / 1 = 20. That is not quality but risk that prices do not show.
A higher return does not have to bring a better ratio. From 1996 to 2024, US shares earned about 9.8% a year and a large US bond fund about 4.2%. Both scored about 0.5, because the bond fund was so much calmer. Yet over the ten years to August 2026 the same bond fund scored below zero: every figure depends on the years chosen.
The next figure adds the other two ratios. The Sharpe scale does not apply to them.
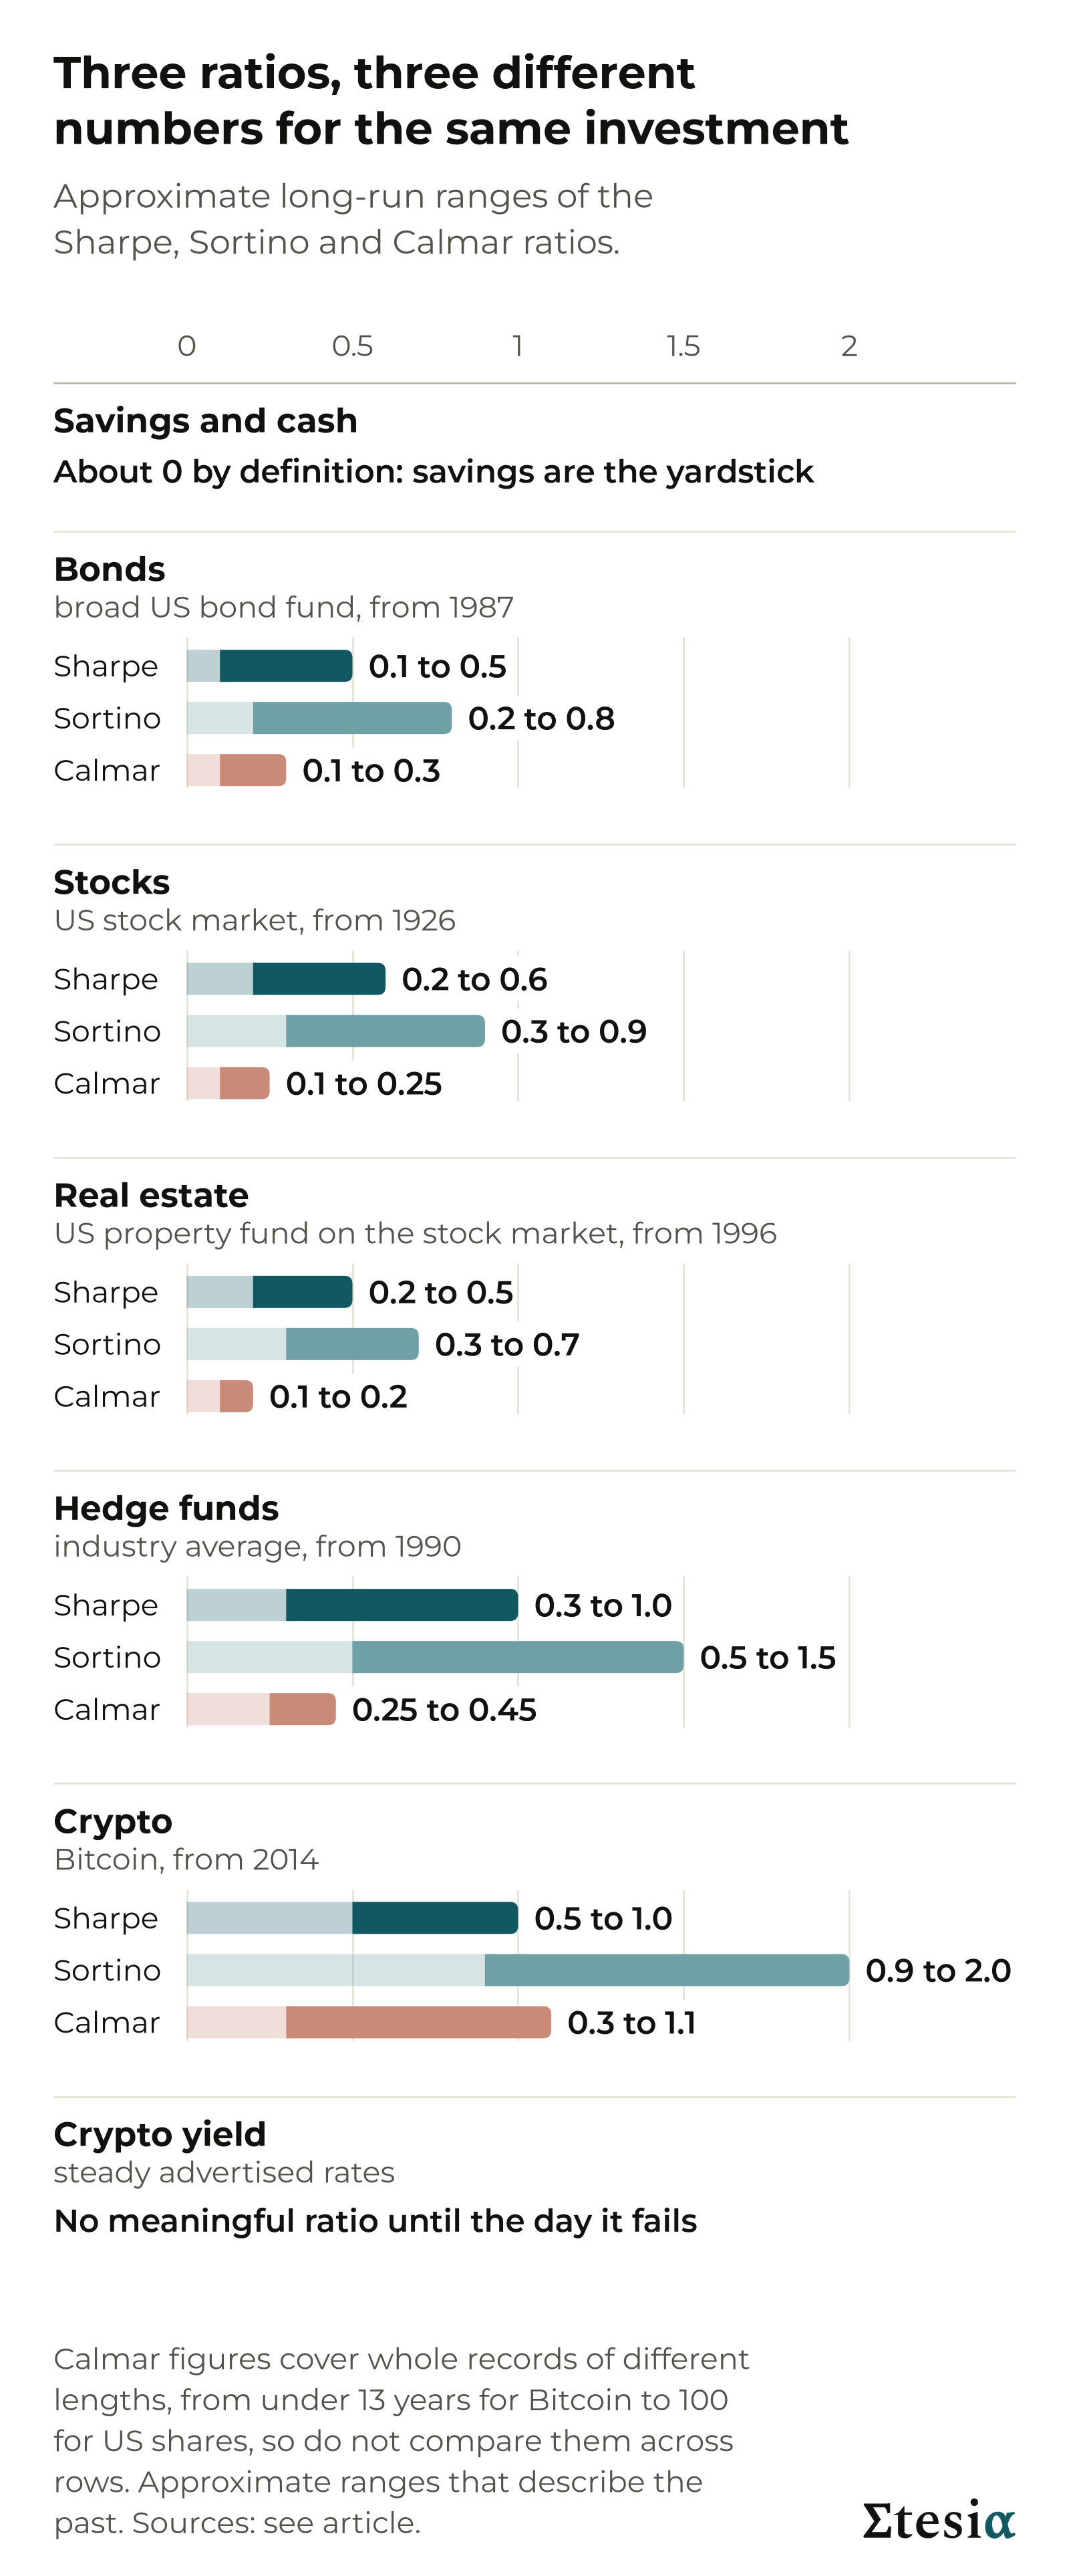
Takeaway: over the long run, stocks, bonds and property have scored well under 1. A higher return did not always bring a better ratio.
Simulated or live: where the number comes from
A backtest is a simulation: the rules of a strategy applied to past prices, with no money at risk. With hindsight, the rules can be adjusted, knowingly or not, until the past looks good. And real-world costs are estimated, not paid.
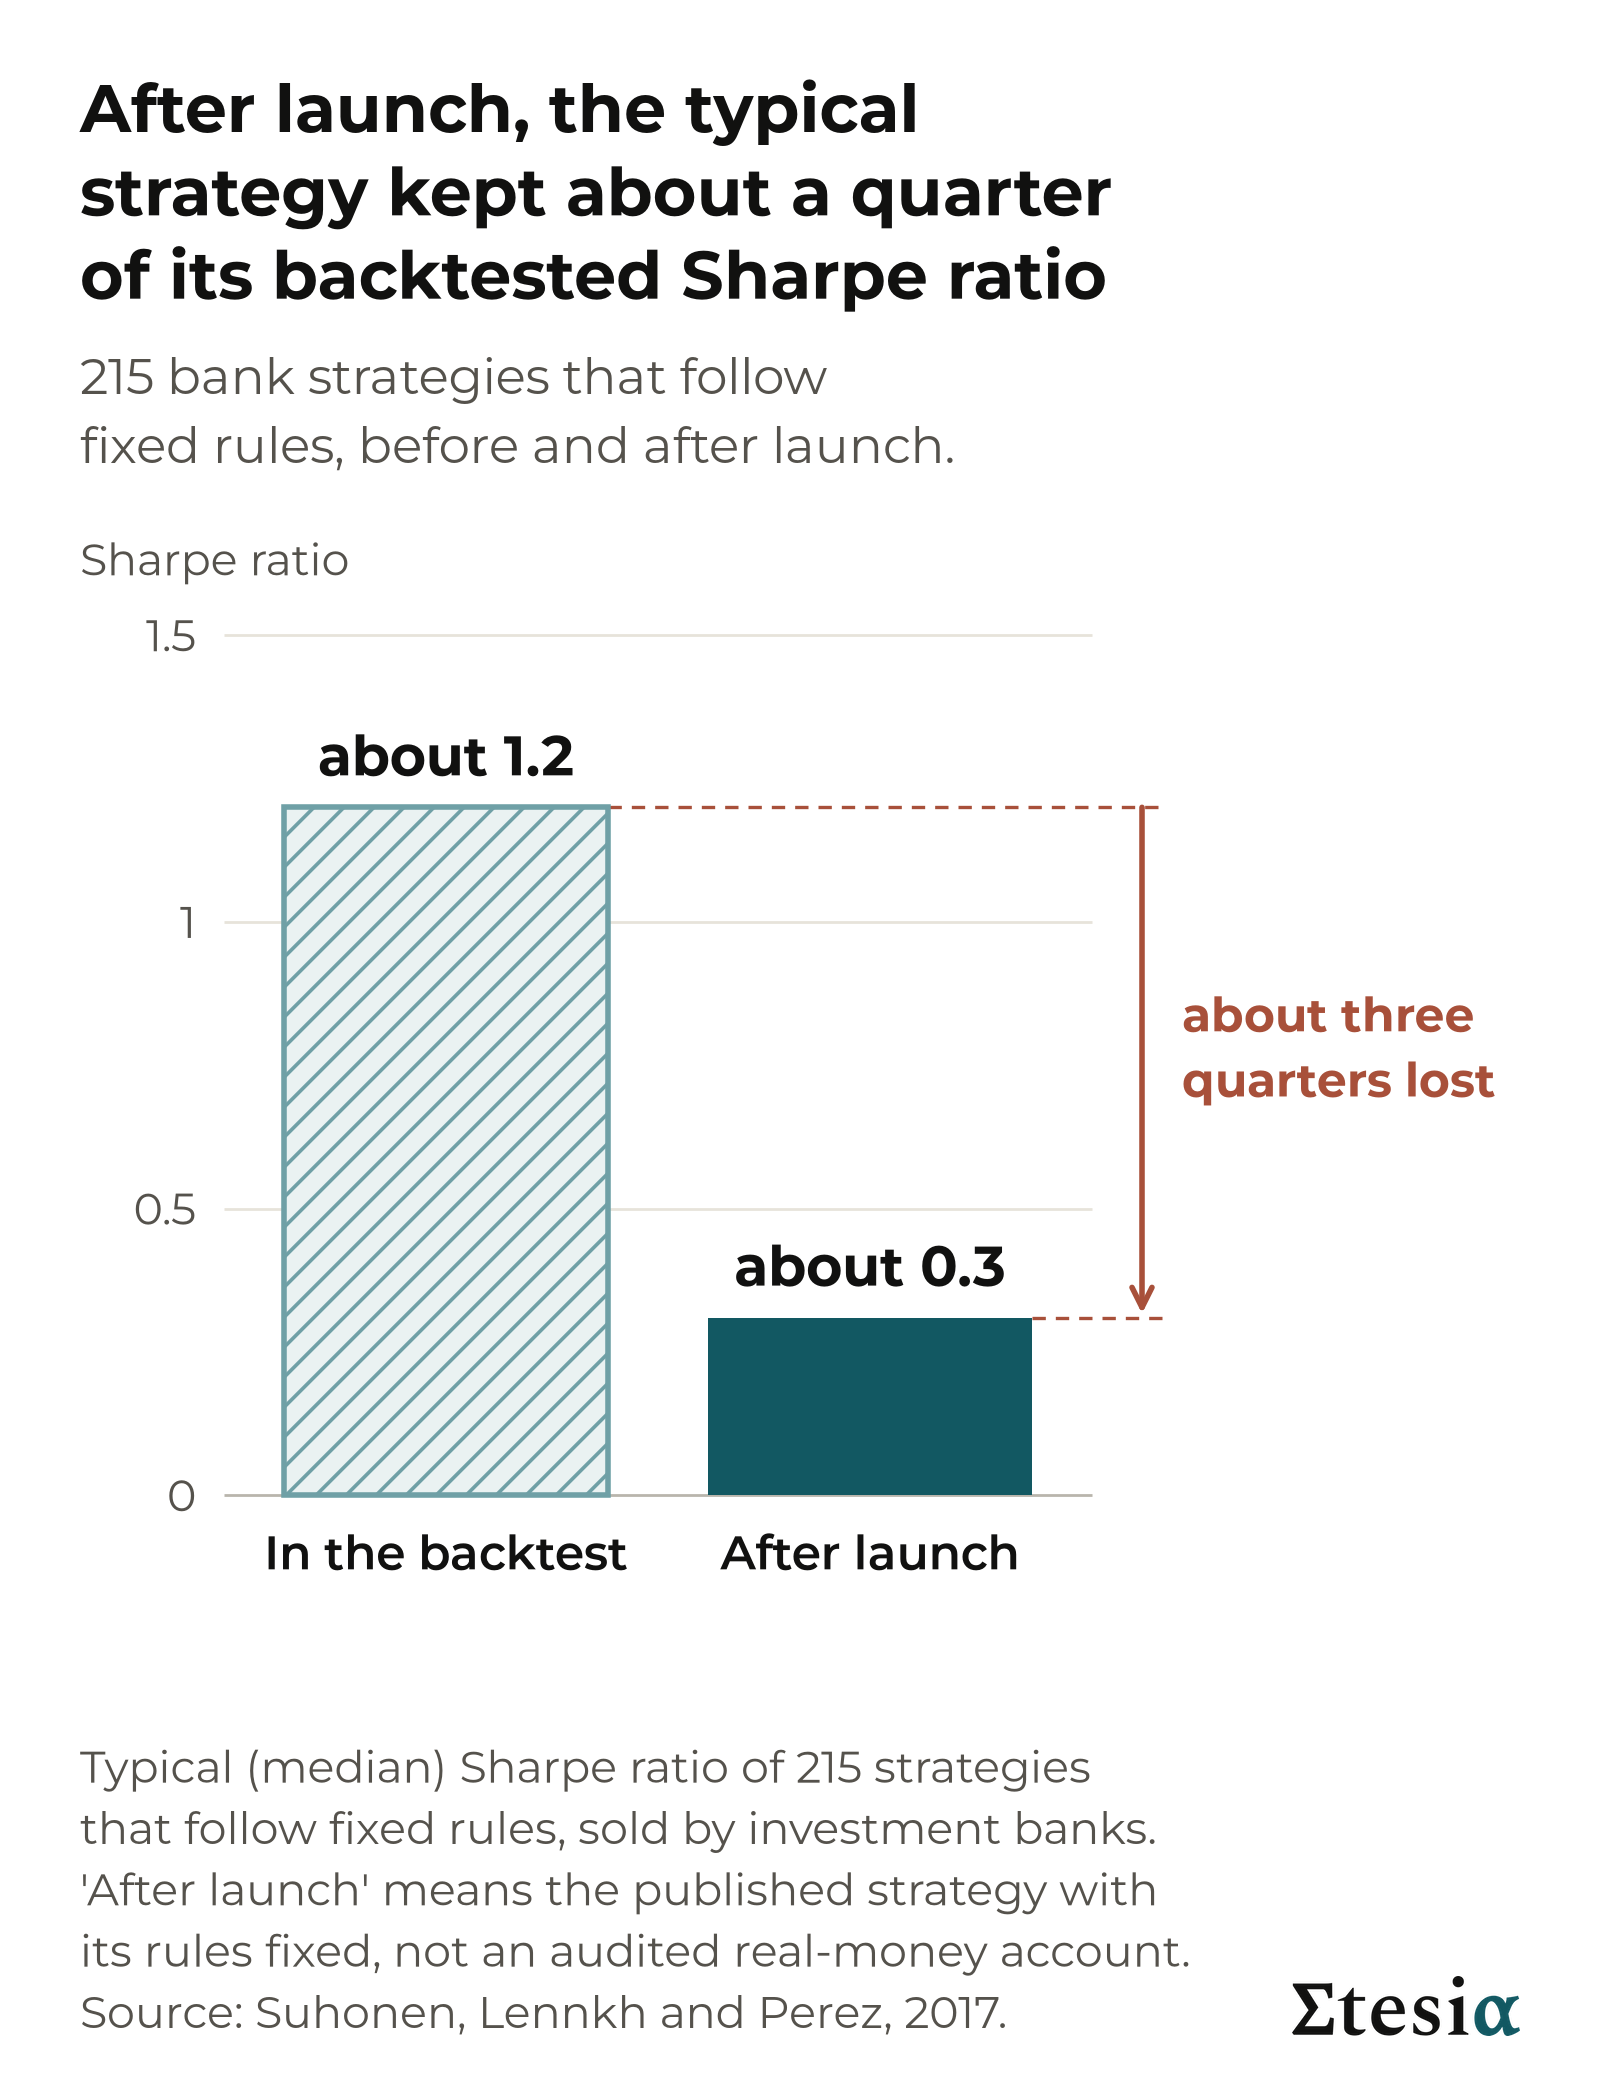
So results after launch usually come in below the backtest. A 2017 study covered 215 strategies that follow fixed rules, sold by investment banks. Their typical Sharpe ratio was about 1.2 in the backtest and about 0.3 after launch.
A live track record is real money and real trades. But it is often short, and a ratio measured over a short time proves little. After one year, a fund showing a Sharpe ratio of 1 could really be anywhere from about minus 1 to 3. Even a long record does not guarantee future performance. Markets change, and the records you see are those of funds that survived.
Both are evidence: a backtest weaker, a live record stronger, and neither is proof. So ask of any ratio: is it simulated or live, over how long, after costs and fees, and can anyone check it?
Takeaway: a backtest shows what the rules would have done, a live record what they did. Ask which one you are looking at.
Where Etesia stands
Etesia runs trading strategies that follow fixed rules. The first primer gave the two risk numbers they are built around, and their limits.
Etesia aims for a Sharpe ratio of about 2: a target the strategies are designed around, not a result and not a guarantee. A risk level can be set. A Sharpe ratio is an outcome. This primer gives no return figure for Etesia, and none should be read into the target.
An earlier Etesia article said to expect a Sharpe ratio near 1 from one strategy, trend following. Our target is for the whole programme: several strategies designed to move independently. The reasoning: their swings should partly cancel while their returns add, so the whole can score higher than any one part. In a crisis they can still fall together.
The ranges above are results measured over decades. Ours is a target, so the two are not comparable.
Put the four questions to it.
- Simulated or live? Mainly simulated, plus a short live record: our first strategy has traded real money since 27 May 2026.
- Over how long? A few months. That proves little.
- After costs and fees? The target is before our fees. In the simulation, costs are estimated, not paid.
- Can anyone check it? Not the simulation: you have only our word. The live deposits, trades and withdrawals are public on the blockchain (a shared record that anyone can inspect).
The previous section applies to us too: results after launch usually come in below the simulation. By that test, ours is a target to be judged over time.
Takeaway: the Sharpe ratio of about 2 that Etesia aims for is a target, not a result and not a guarantee. Judge it over time.
What the ratios do not tell you
All three ratios are computed from past prices. They are blind to any risk not yet shown on the chart.
Selling volatility. XIV was a product traded on the stock market whose holders were, in effect, selling insurance against market turbulence (known as selling volatility). It gained about 188% in 2017. On 5 February 2018, US shares fell 4.1% and XIV lost more than 96% of its value.
Crypto yield. A product called Anchor advertised up to 20% interest on TerraUSD, a stablecoin (a coin meant to stay worth one dollar). On paper, that is a high return with almost no volatility. In May 2022 the coin fell close to zero.
Invented numbers. A fund that passed its investors’ money to Bernard Madoff reported returns that work out to a Sharpe ratio of about 2.5 for almost 18 years. On the scale above, that reads as rare and excellent, not as a warning. The returns were invented.
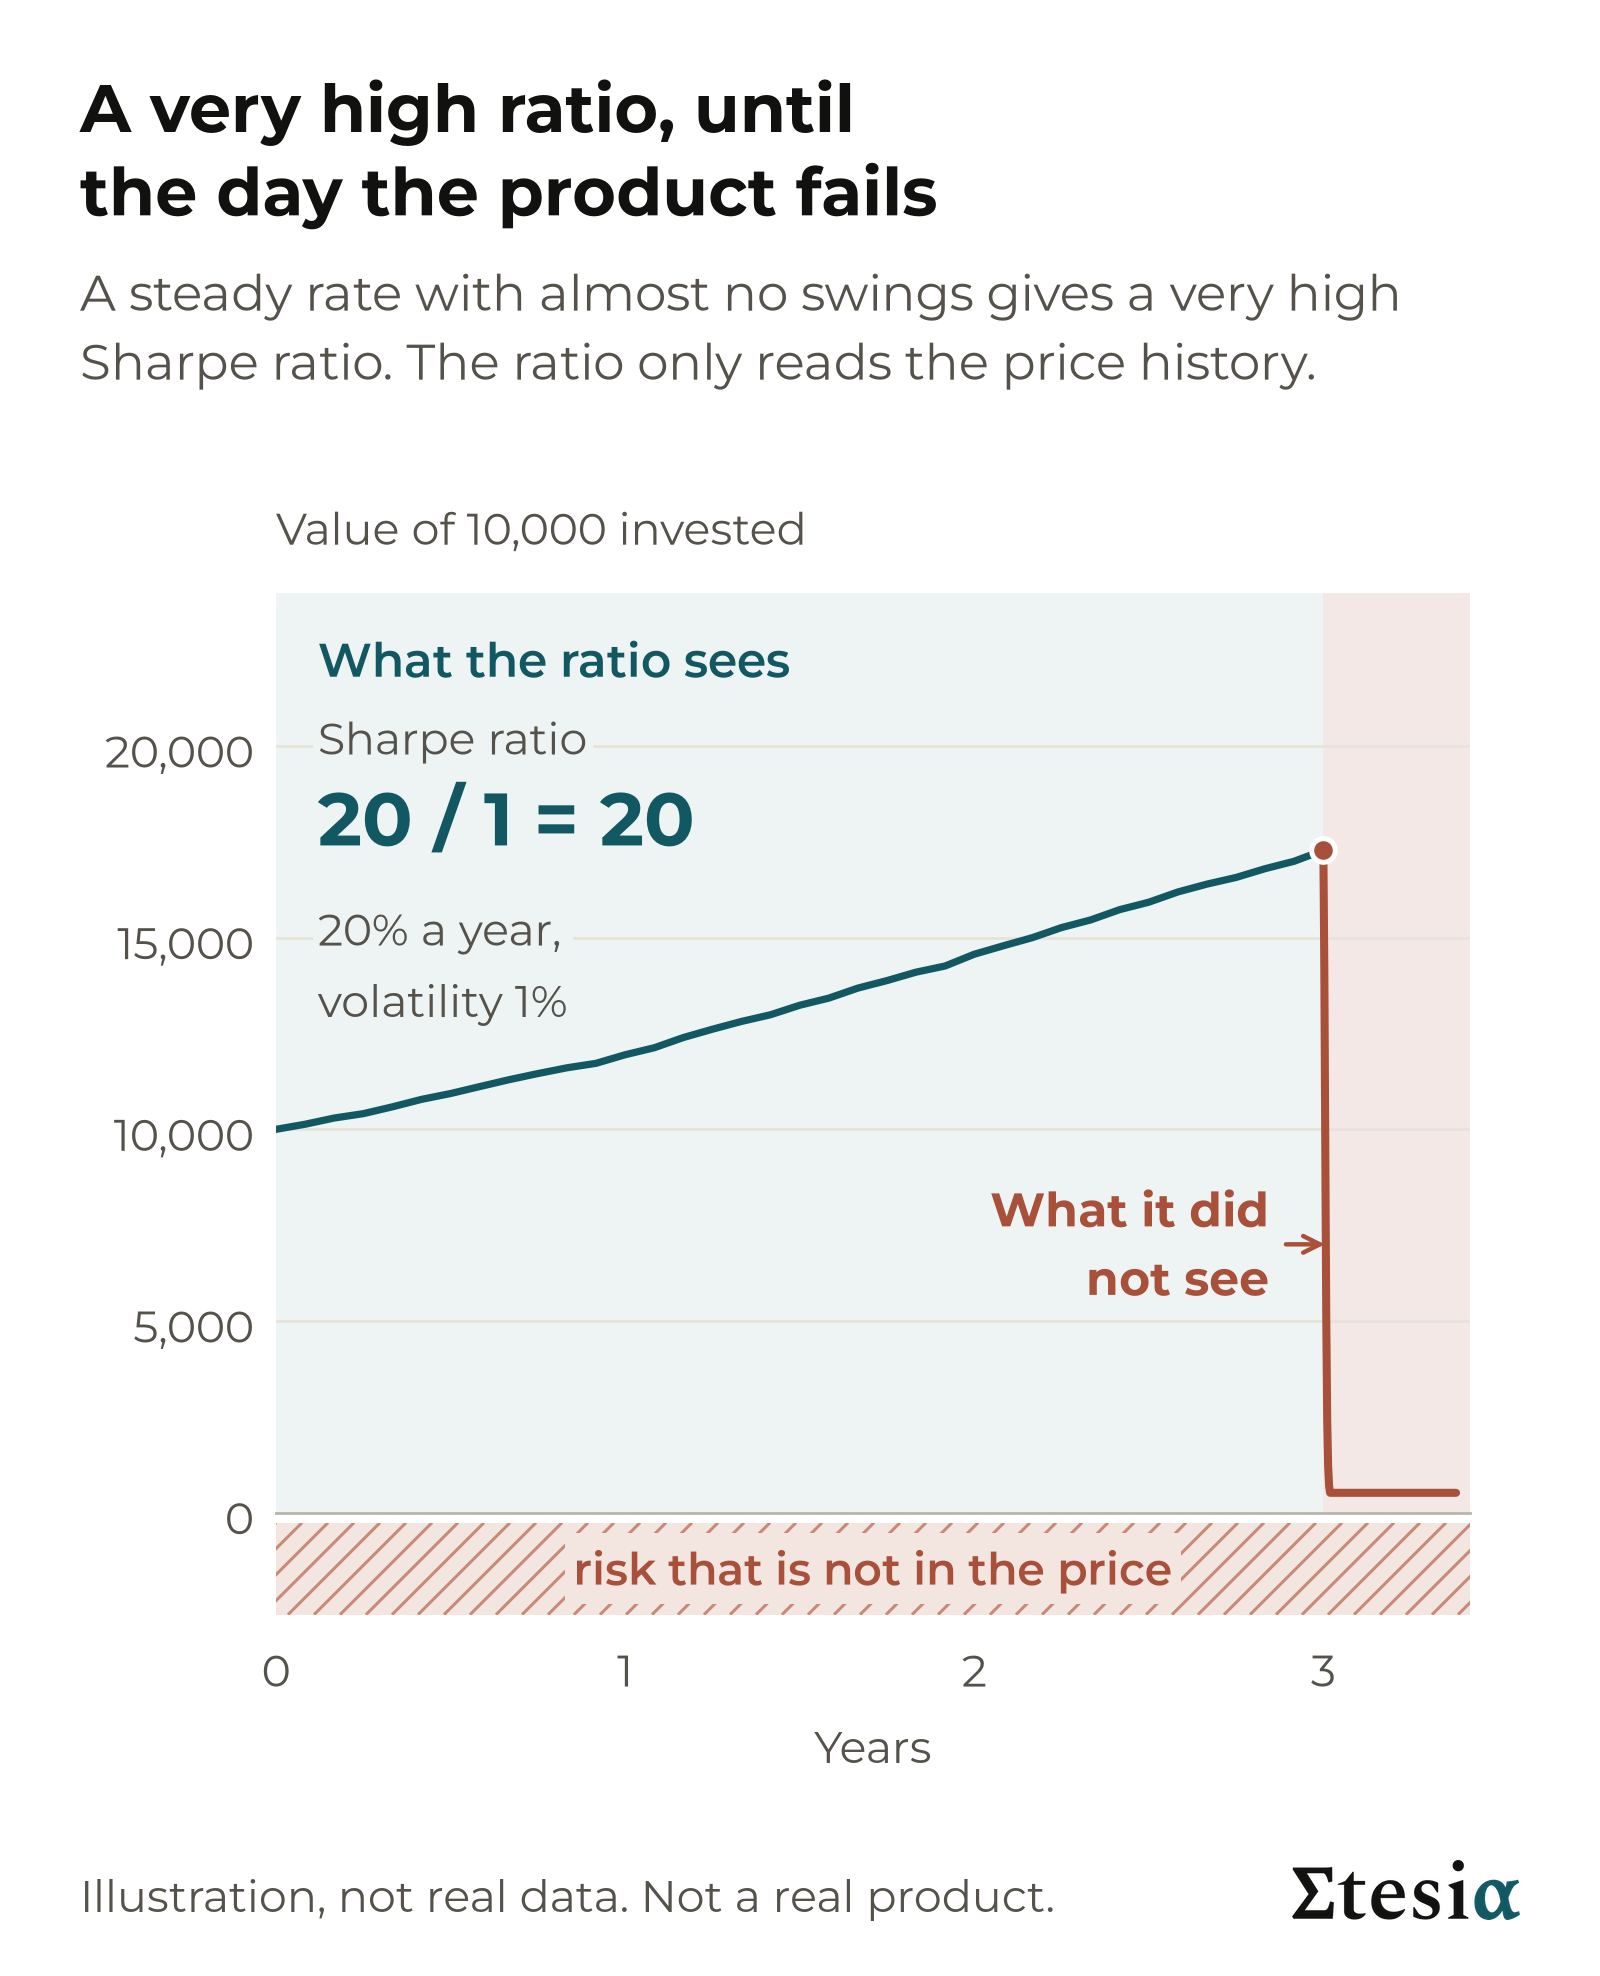
In each case, a ratio computed on the good years said nothing about what came next. That holds for every investment in this primer, Etesia’s included.
Takeaway: a ratio only sees the price history. An excellent ratio is not proof of low risk.
How to use the three ratios together
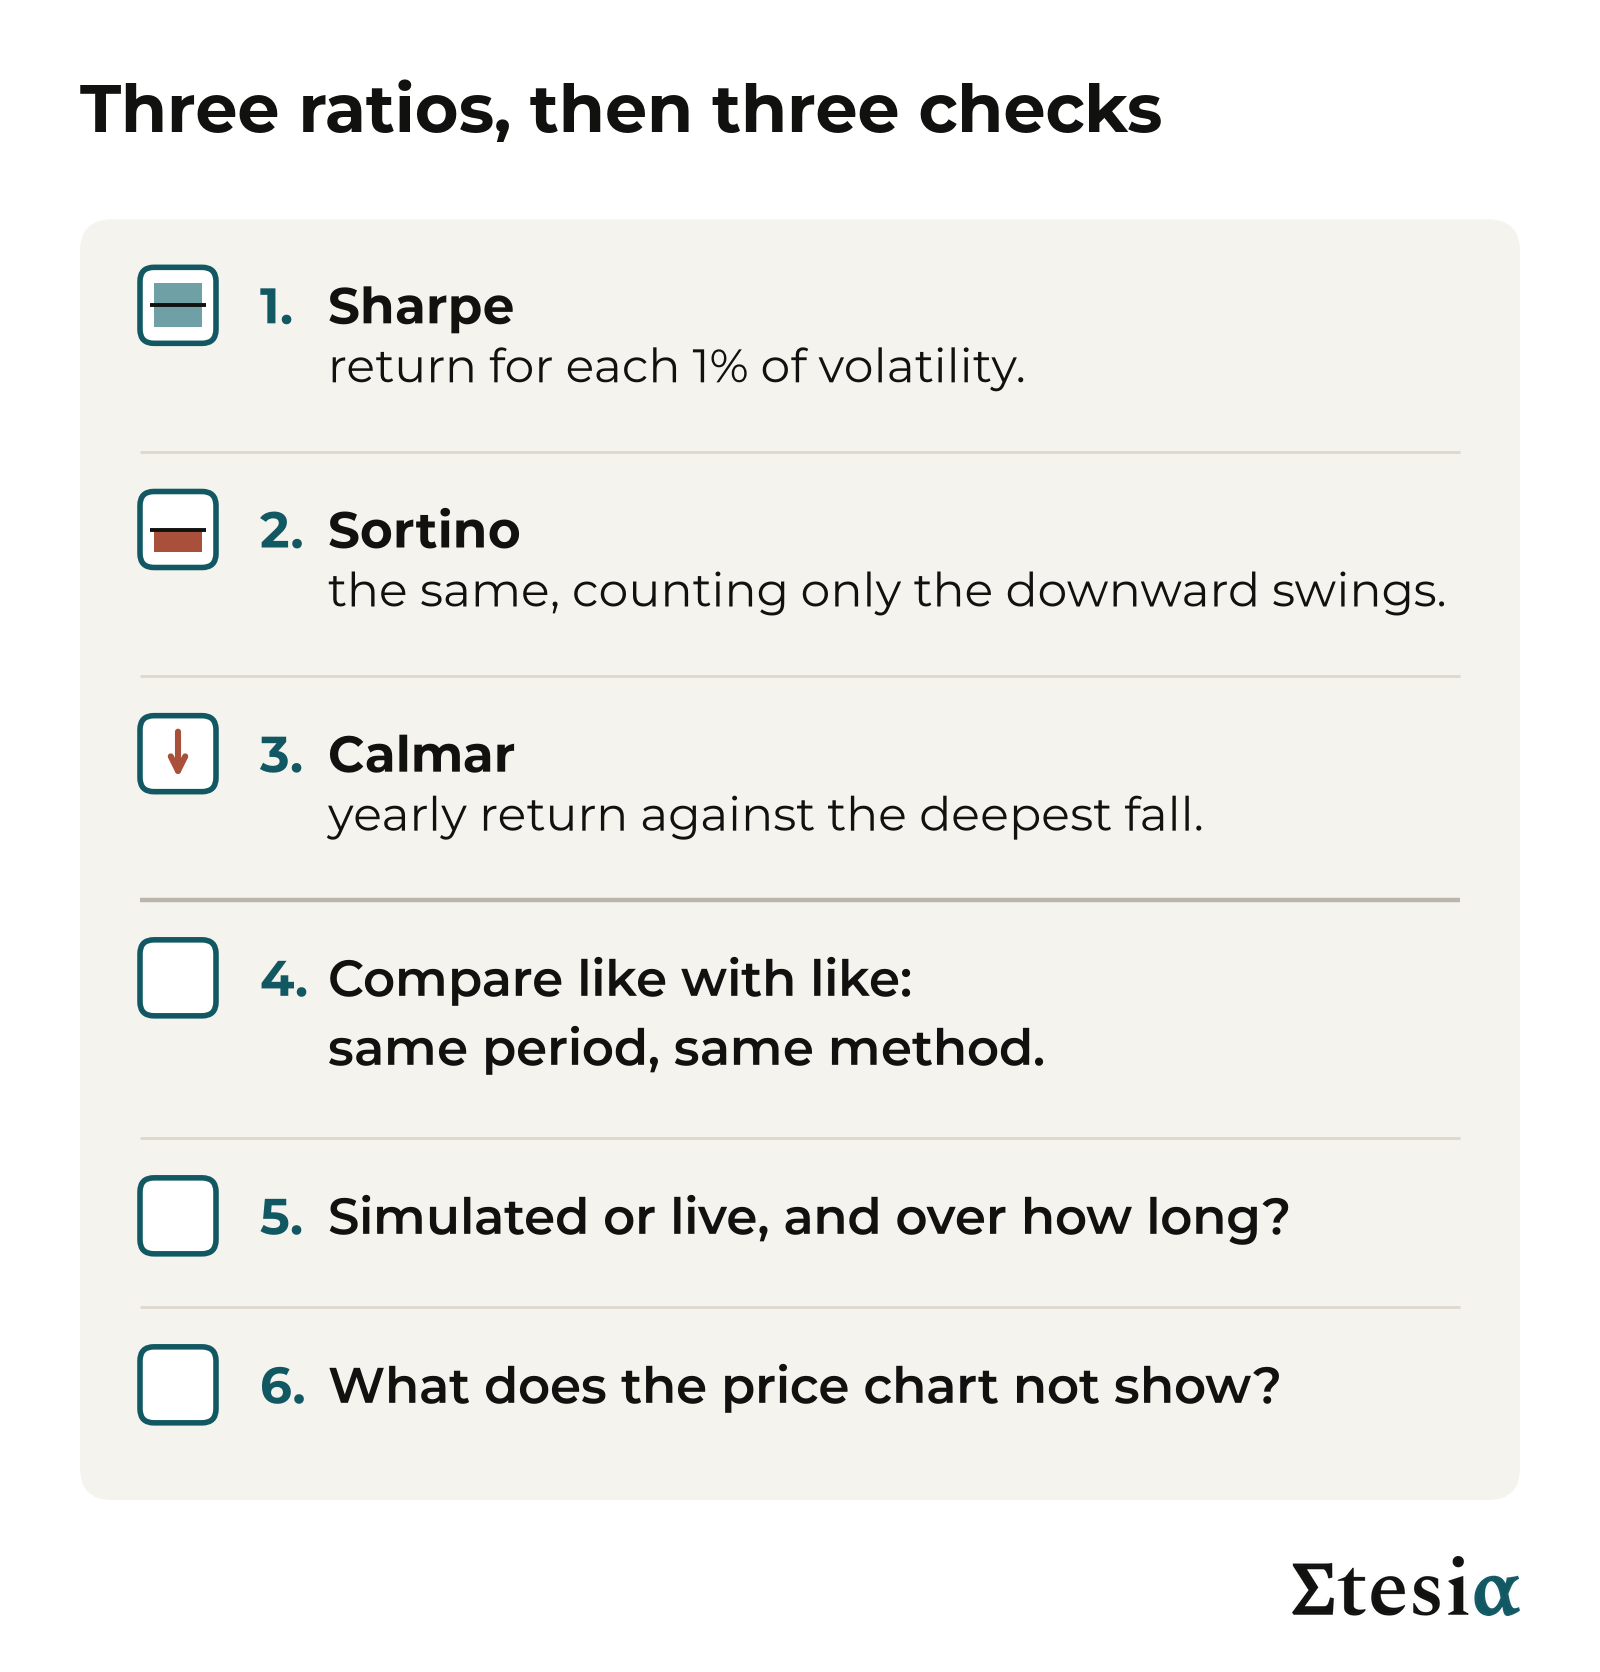
- Sharpe: the return for each 1% of volatility. Start here.
- Sortino: the same, counting only the downward swings.
- Calmar: the yearly return against the deepest fall.
- Compare like with like: same period, same method.
- Ask: simulated or live, and over how long? After costs and fees? Who can check it?
- Then ask what the price chart does not show.
So which fund did better? Fund A earned more. Fund B earned twice as much for each 1% of swing. Those are answers to two different questions: how much, and at what risk. An advert usually answers only the first.
Takeaway: use the three ratios together, compare like with like, and ask where each number comes from.
Next in this series: the risks the ratios do not show, and how an investment can look excellent on paper until the day it fails.
Sources
The figures in this article come from public sources: academic papers, regulators, court records, index providers and data vendors. The ratios by investment type were computed by Etesia from public monthly data. The main sources are listed here.
- The three ratios: William F. Sharpe, “Mutual Fund Performance” (1966) and “The Sharpe Ratio” (1994); Frank A. Sortino and Lee N. Price, The Journal of Investing (1994); Terry W. Young, Futures magazine (1991). The range given for a one-year record follows Andrew W. Lo, “The Statistics of Sharpe Ratios” (2002); it is the range that holds about 19 times in 20.
- Savings rate: US Department of the Treasury (Treasury bill rates). The market figures use Treasury bills, short loans to the US government, as the savings rate.
- Stocks: Kenneth R. French data library (US stock market and Treasury bills, 1926 to 2026); Aswath Damodaran, NYU Stern (S&P 500 and Treasury bills, 1928 to 2025); Invesco (MSCI World Index).
- Bonds and property: month-end prices of Vanguard index funds, from Yahoo Finance; Nareit, reporting a CEM Benchmarking study.
- Hedge funds: Hedge Fund Research, HFRI Fund Weighted Composite Index (an industry average).
- Crypto: Coin Metrics (Bitcoin prices).
- Backtests and live records: Suhonen, Lennkh and Perez, The Journal of Portfolio Management (2017), read through its abstract and published summaries.
- What the ratios do not tell you: US Court of Appeals for the Second Circuit, Set Capital v. Credit Suisse (2021), and InvestmentNews (XIV); US Securities and Exchange Commission (TerraUSD); Bernard and Boyle, The Journal of Derivatives (2009) (Madoff).
The worked examples divide the yearly growth rate by the volatility and skip the savings step, to keep the sums simple. The market Sharpe and Sortino figures use the standard method: the average of monthly returns above the return on Treasury bills.
The ranges by investment type and the reading scale are Etesia’s own judgement, drawn from these figures and from J.P. Morgan Asset Management’s 2026 Long-Term Capital Market Assumptions. They are not measurements.
This article is general educational content, written as of October 2026. It is not investment advice, not a personal recommendation, and not an offer or invitation to invest in any product, including Etesia’s vaults. Etesia runs investment strategies and so has a commercial interest in this subject. All investing involves risk, including the loss of everything you invest. Crypto-related products are high risk and are usually not covered by deposit insurance or investor compensation schemes. Funds A to F and every price path shown are invented illustrations, not real products or data. Historical figures are approximate. The ratio ranges and the reading scale are Etesia’s judgements: they depend on the period and the method of calculation, and describe the past. Simulated results are not live results, and past performance is not a reliable indicator of future results. The Sharpe ratio of about 2 that Etesia aims for rests mainly on simulation and is a design target, not a result and not a guarantee. The volatility and drawdown figures given in the first primer are design targets too, not results and not guarantees.